You found a setting that returned 40% over six months. The equity curve looks clean. The win rate is above 50%. It feels like the answer.
A single backtest tells you what happened with that parameter set, on that date range, with that data. Change any one of those and the result can look completely different.
The problem with one number
When you test a strategy with one set of inputs, say a fast moving average of 12 and a slow moving average of 26, you get one result. That result might be good, or it might be the best result out of thousands of possible combinations that you happened to try first.
Overfitting means choosing parameters because they performed well on historical data without asking whether nearby parameters performed similarly.
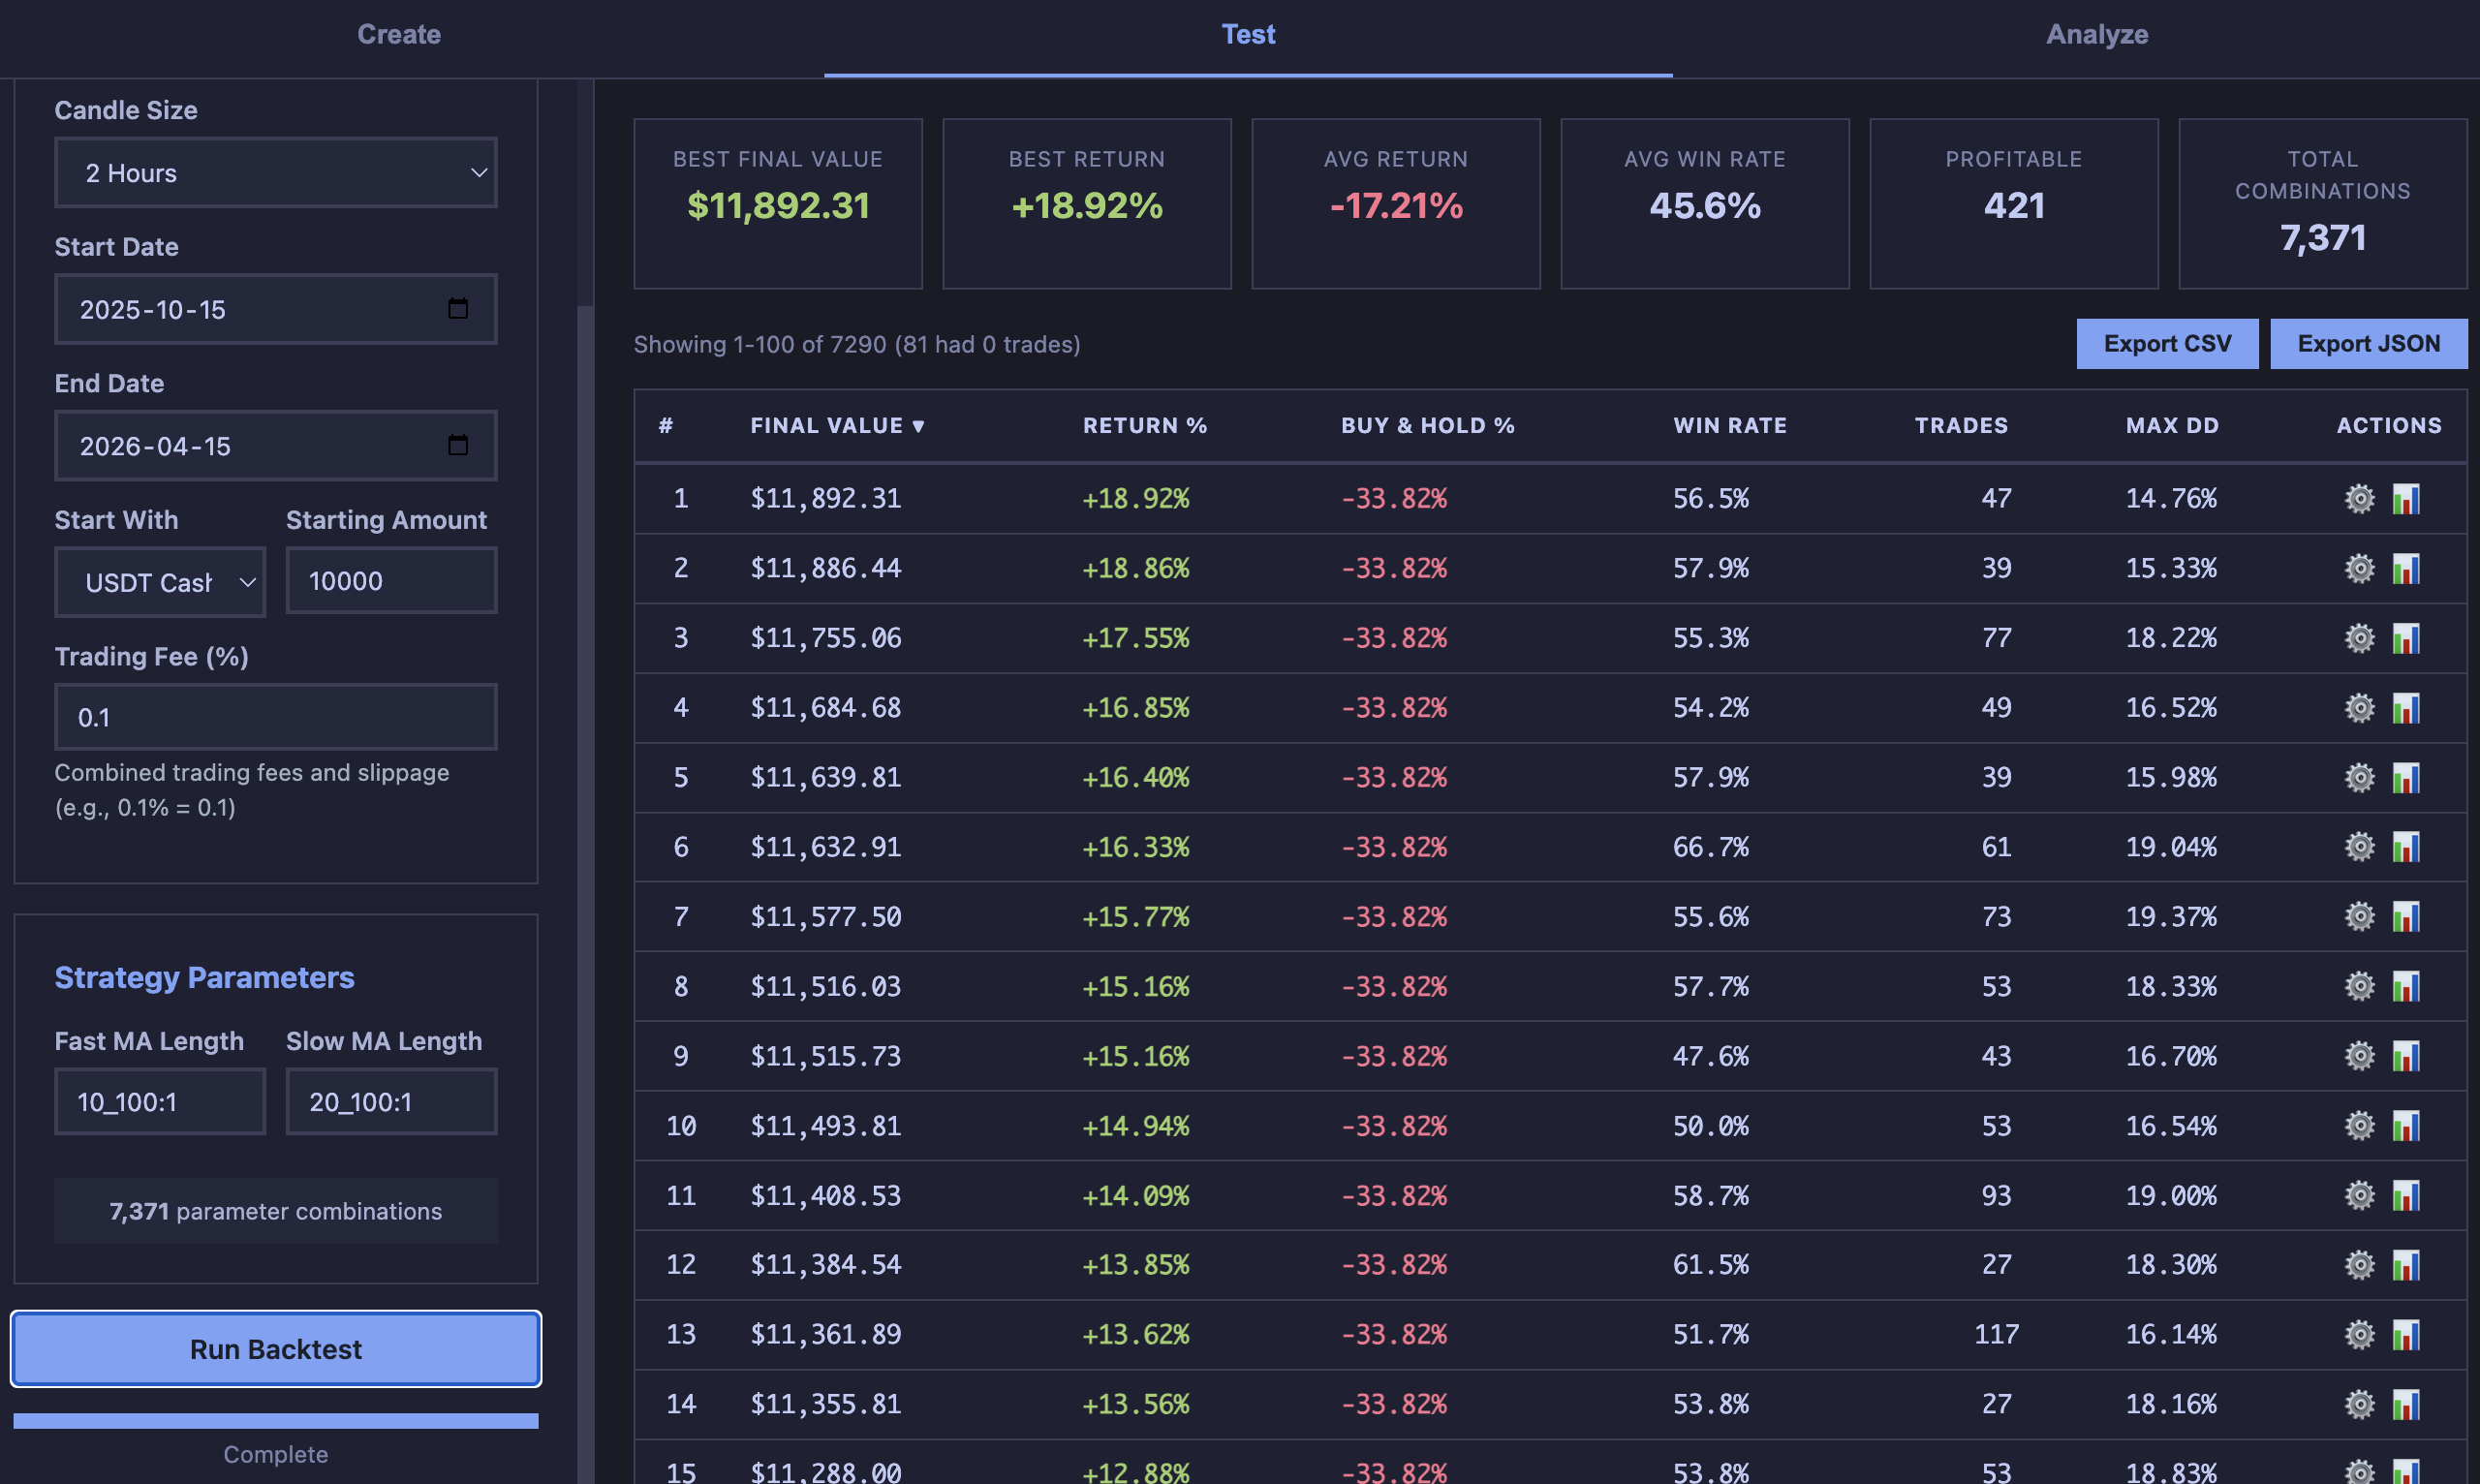
If only one combination in a neighborhood produces a strong return, and everything around it is mediocre or negative, the signal is fragile. You found a peak, not a plateau.
What range testing shows you
Range testing checks whether a region of settings works. You define ranges for each input and test the full grid of combinations.
The ranked results table lets you look at how performance distributes across the parameter space. If the top 25 results cluster around similar input values, that’s a stronger signal than one outlier at the top.
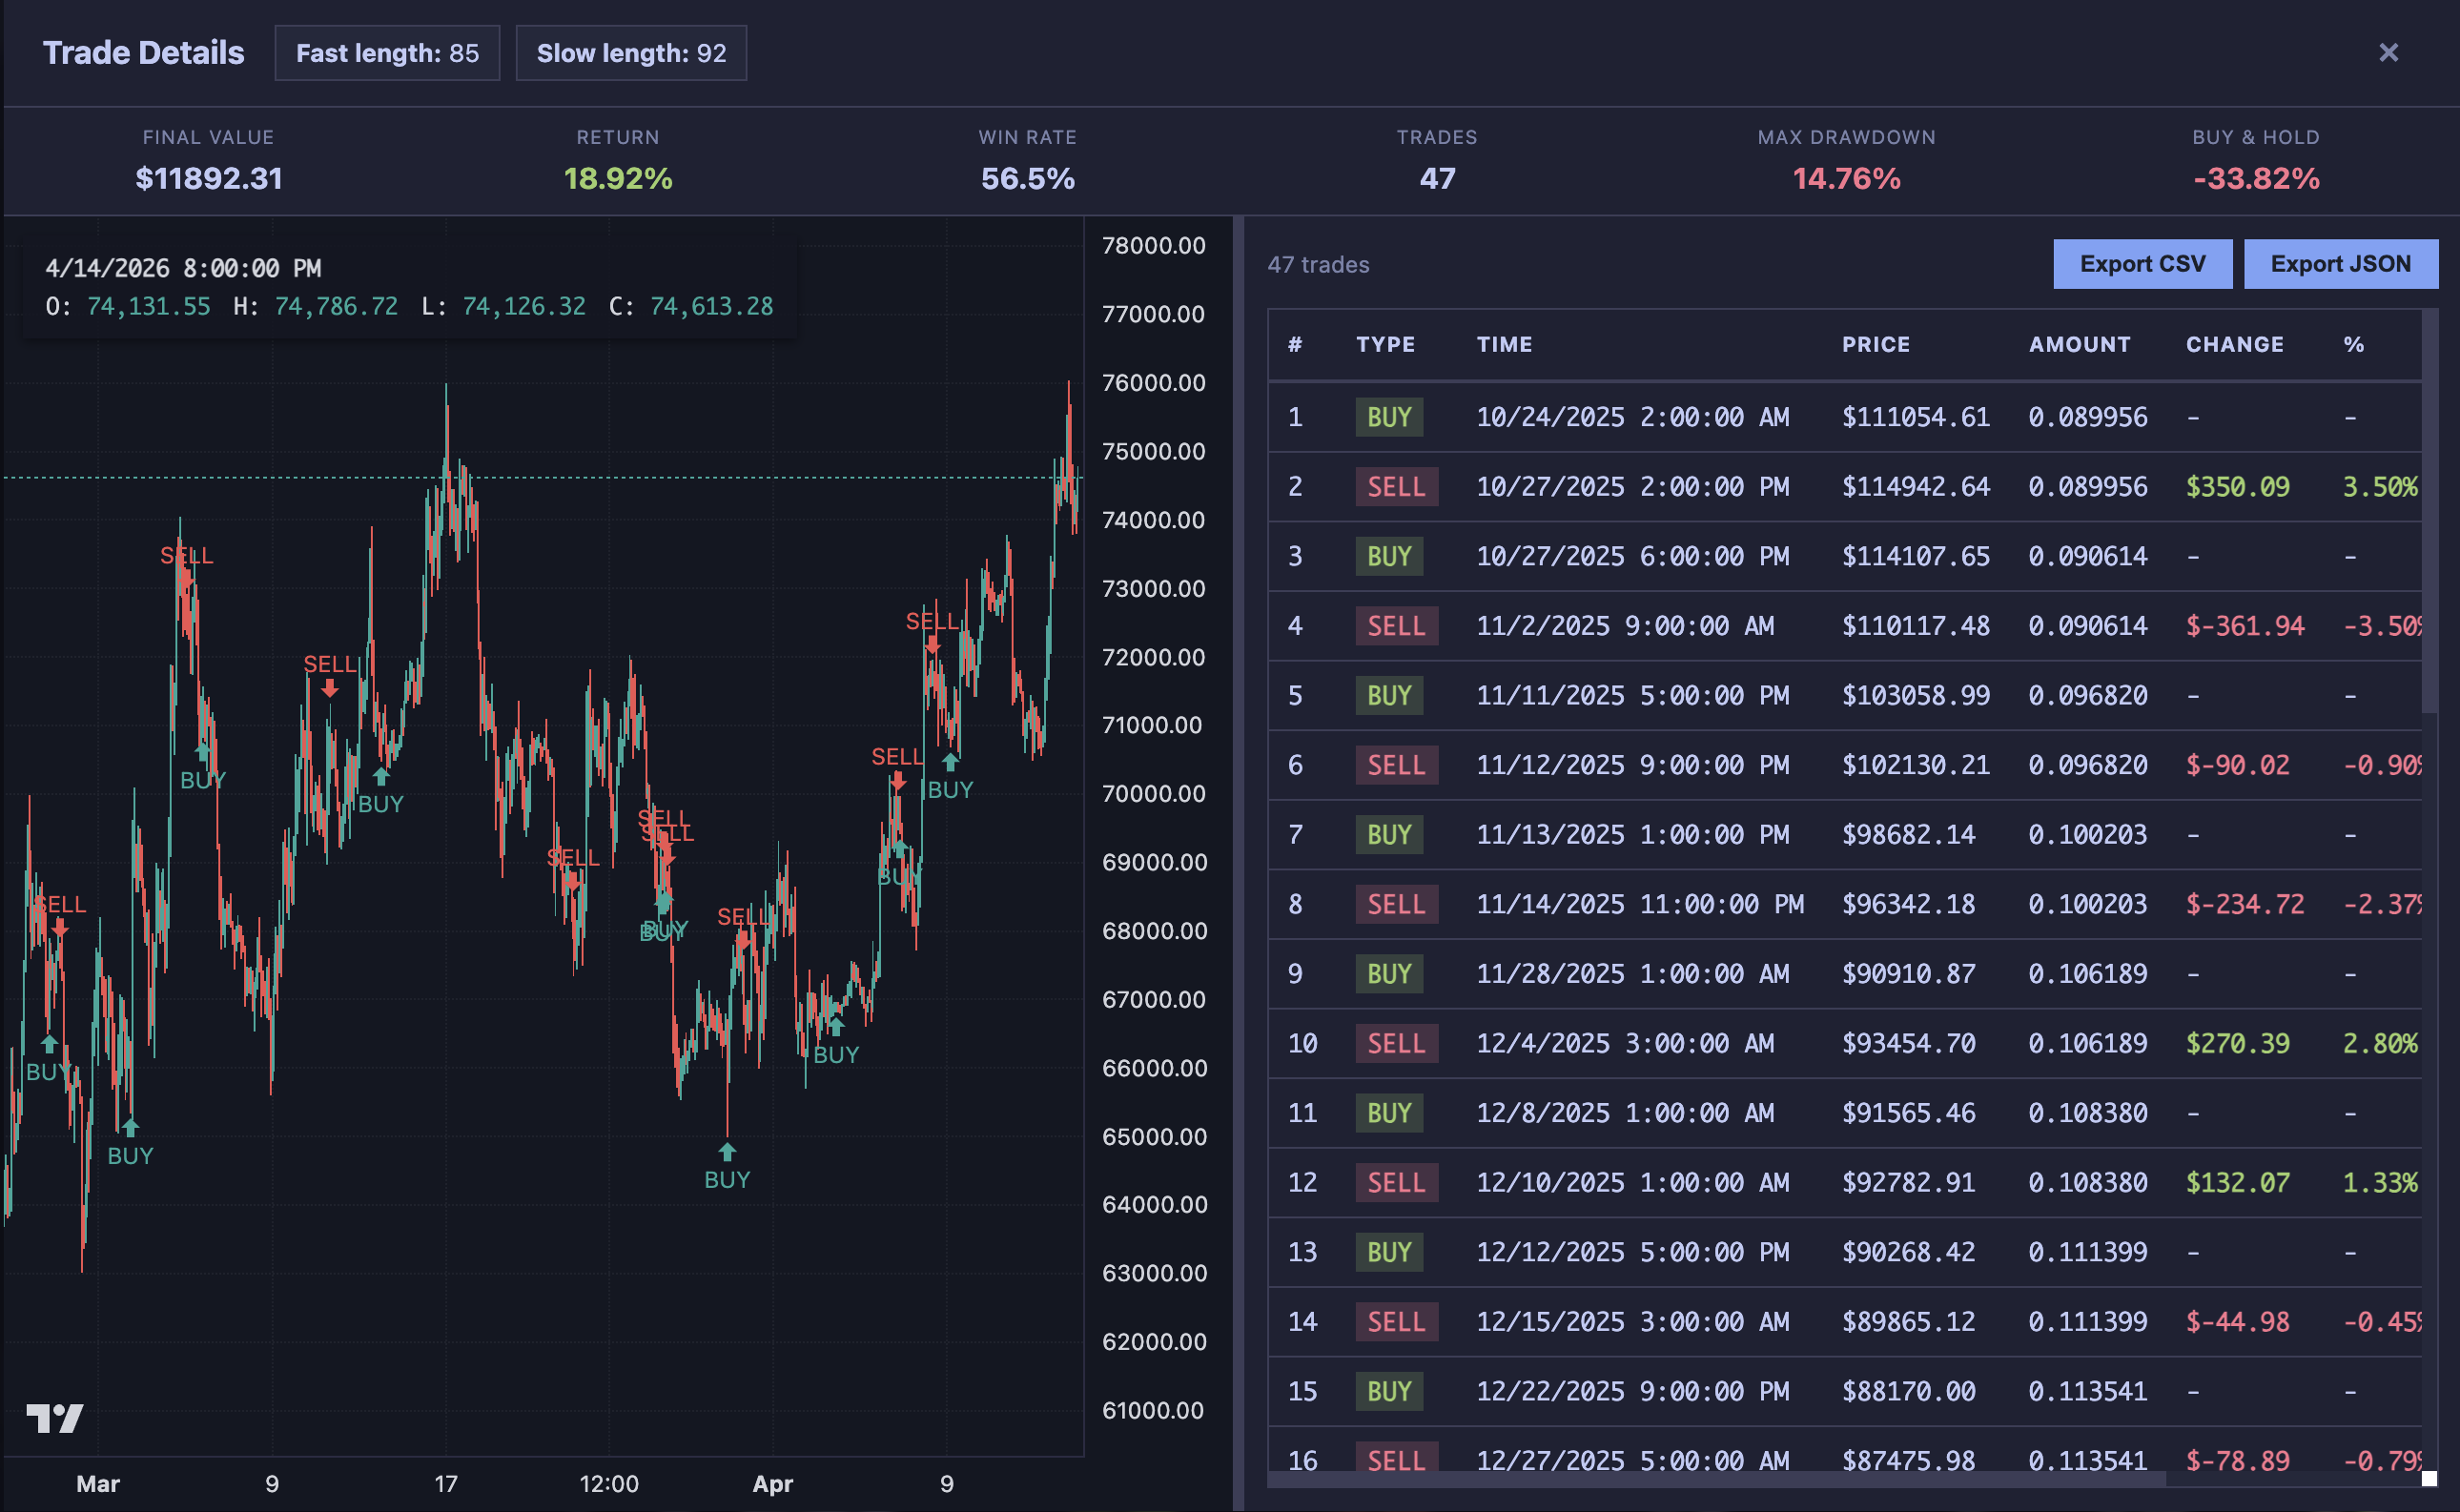
Opening individual results lets you inspect the trades behind the ranking. A result that returned 35% with consistent entries across market regimes tells you more than one that returned 50% from three lucky trades in a trending month.
What to look for
A few patterns that separate stable findings from noise:
- Clustered winners: If fast lengths 50–60 and slow lengths 85–95 all perform well, the evidence points to a region of settings.
- Consistent trade counts: Results with similar trade counts make the result less dependent on a rare edge case.
- Drawdown stability: A top result with 14% max drawdown next to results with 40% drawdown is less trustworthy than a cluster where all results stay under 20%.
What range testing changes
Range testing doesn’t make a strategy profitable. It shows where a strategy tends to work and how fragile the edge may be, giving you a better basis for deciding how much conviction the evidence deserves.
The next step is always the same: open the trades, check the drawdown path, compare to buy and hold, and decide whether the evidence is strong enough to act on.