1
Write
Draft or import your Pine Script strategy.
PINE SCRIPT® BACKTESTING, SIMPLIFIED
TrainBard runs thousands of historical backtests across assets and timeframes so you can focus on what works.
How it works
Three steps from idea to inspectable results.
Draft or import your Pine Script strategy.
Run thousands of backtests across markets and timeframes.
Review performance, drill into details, and iterate.
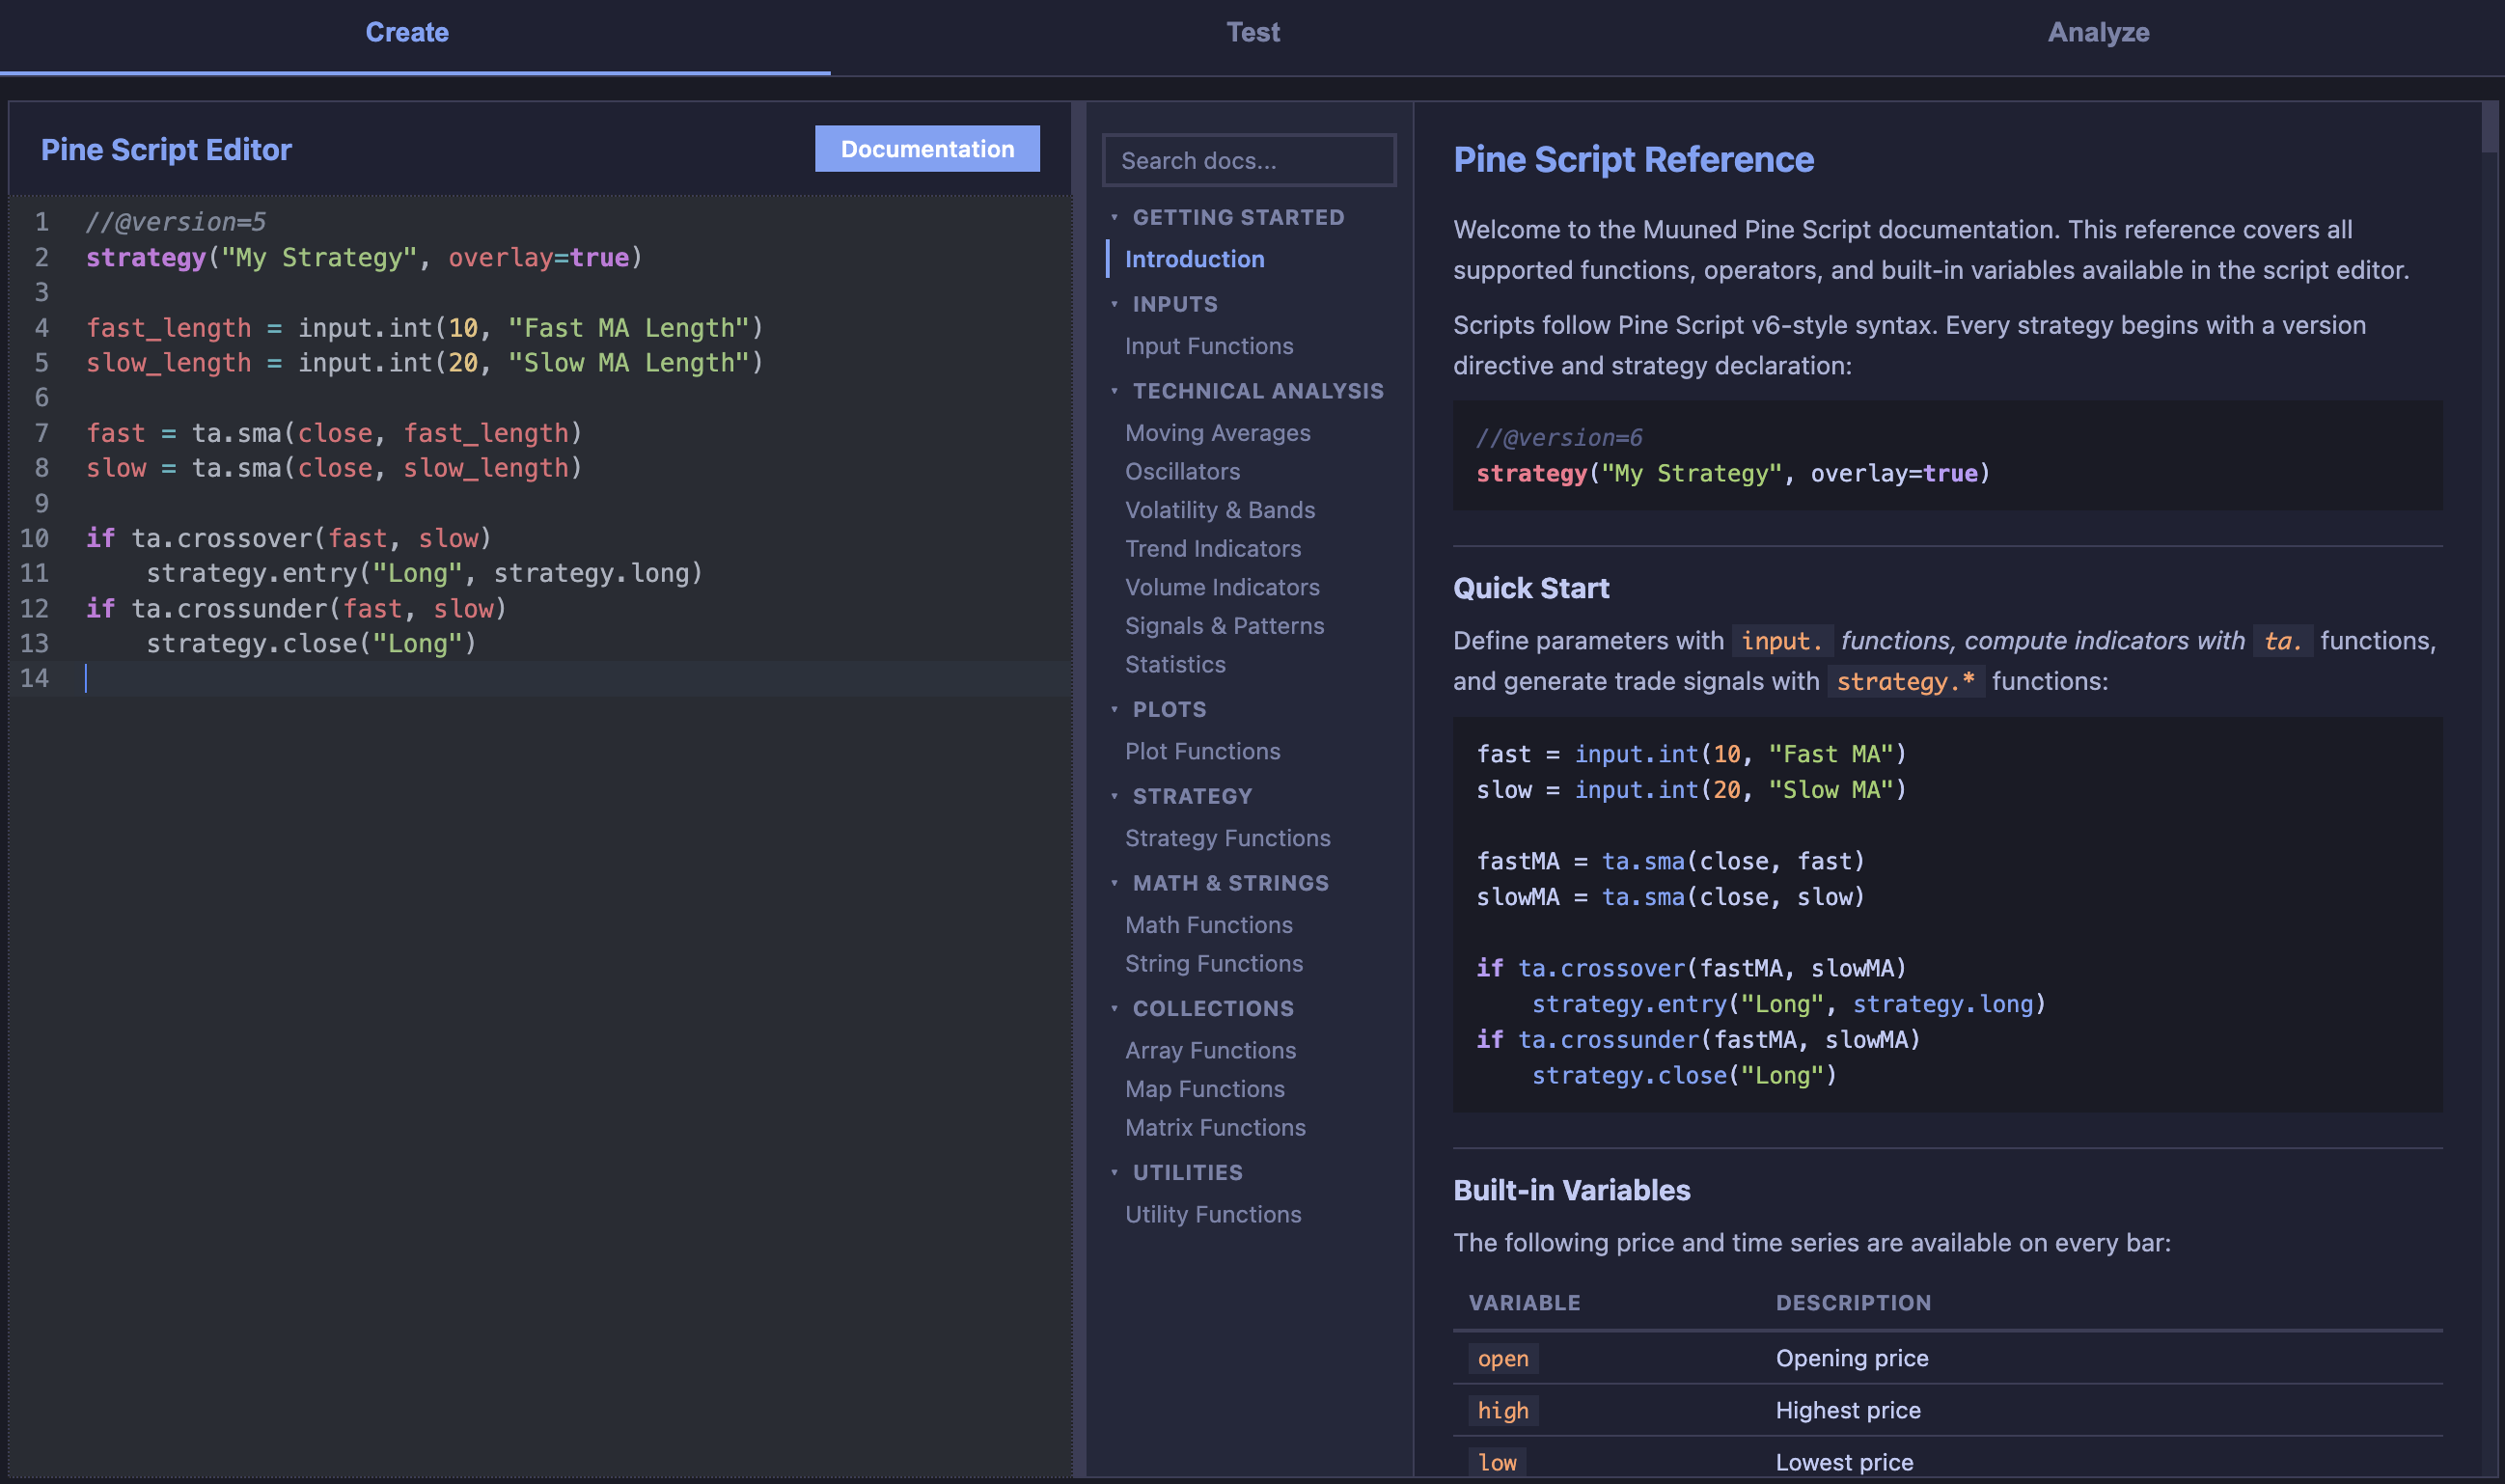
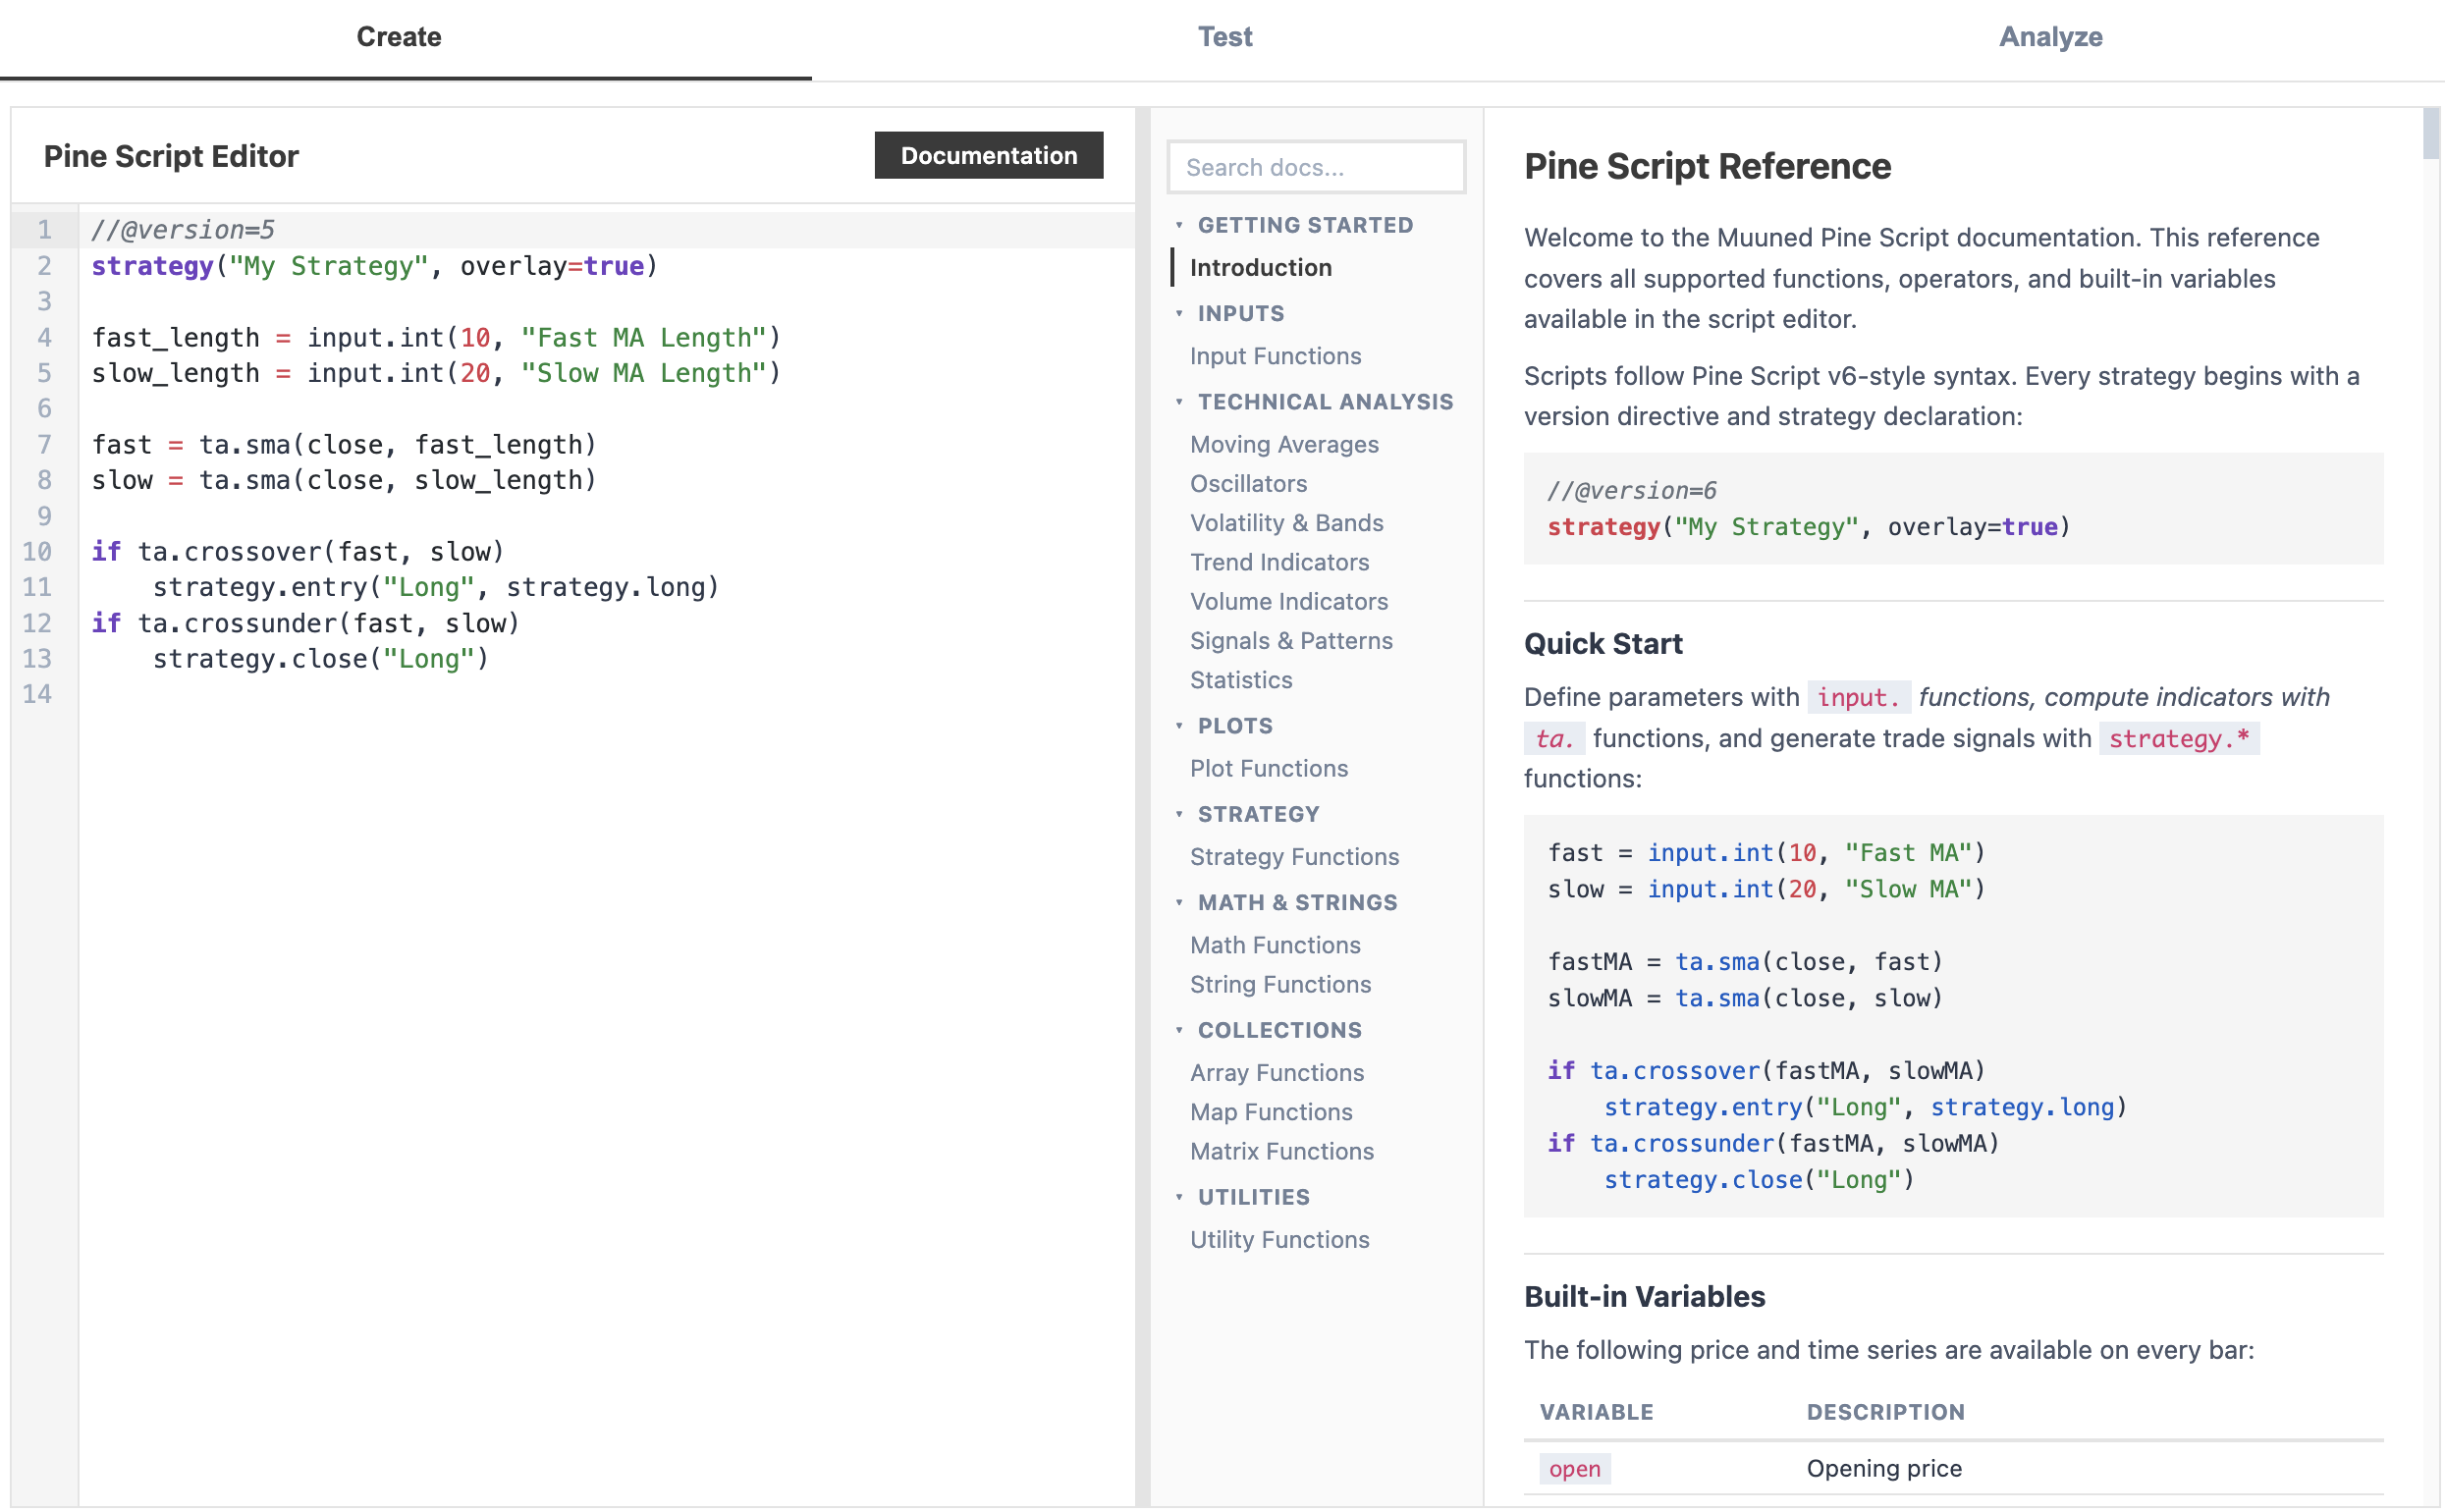
Write
Write or paste a strategy. The docs sit next to your code, so you can shape the idea before you run it.
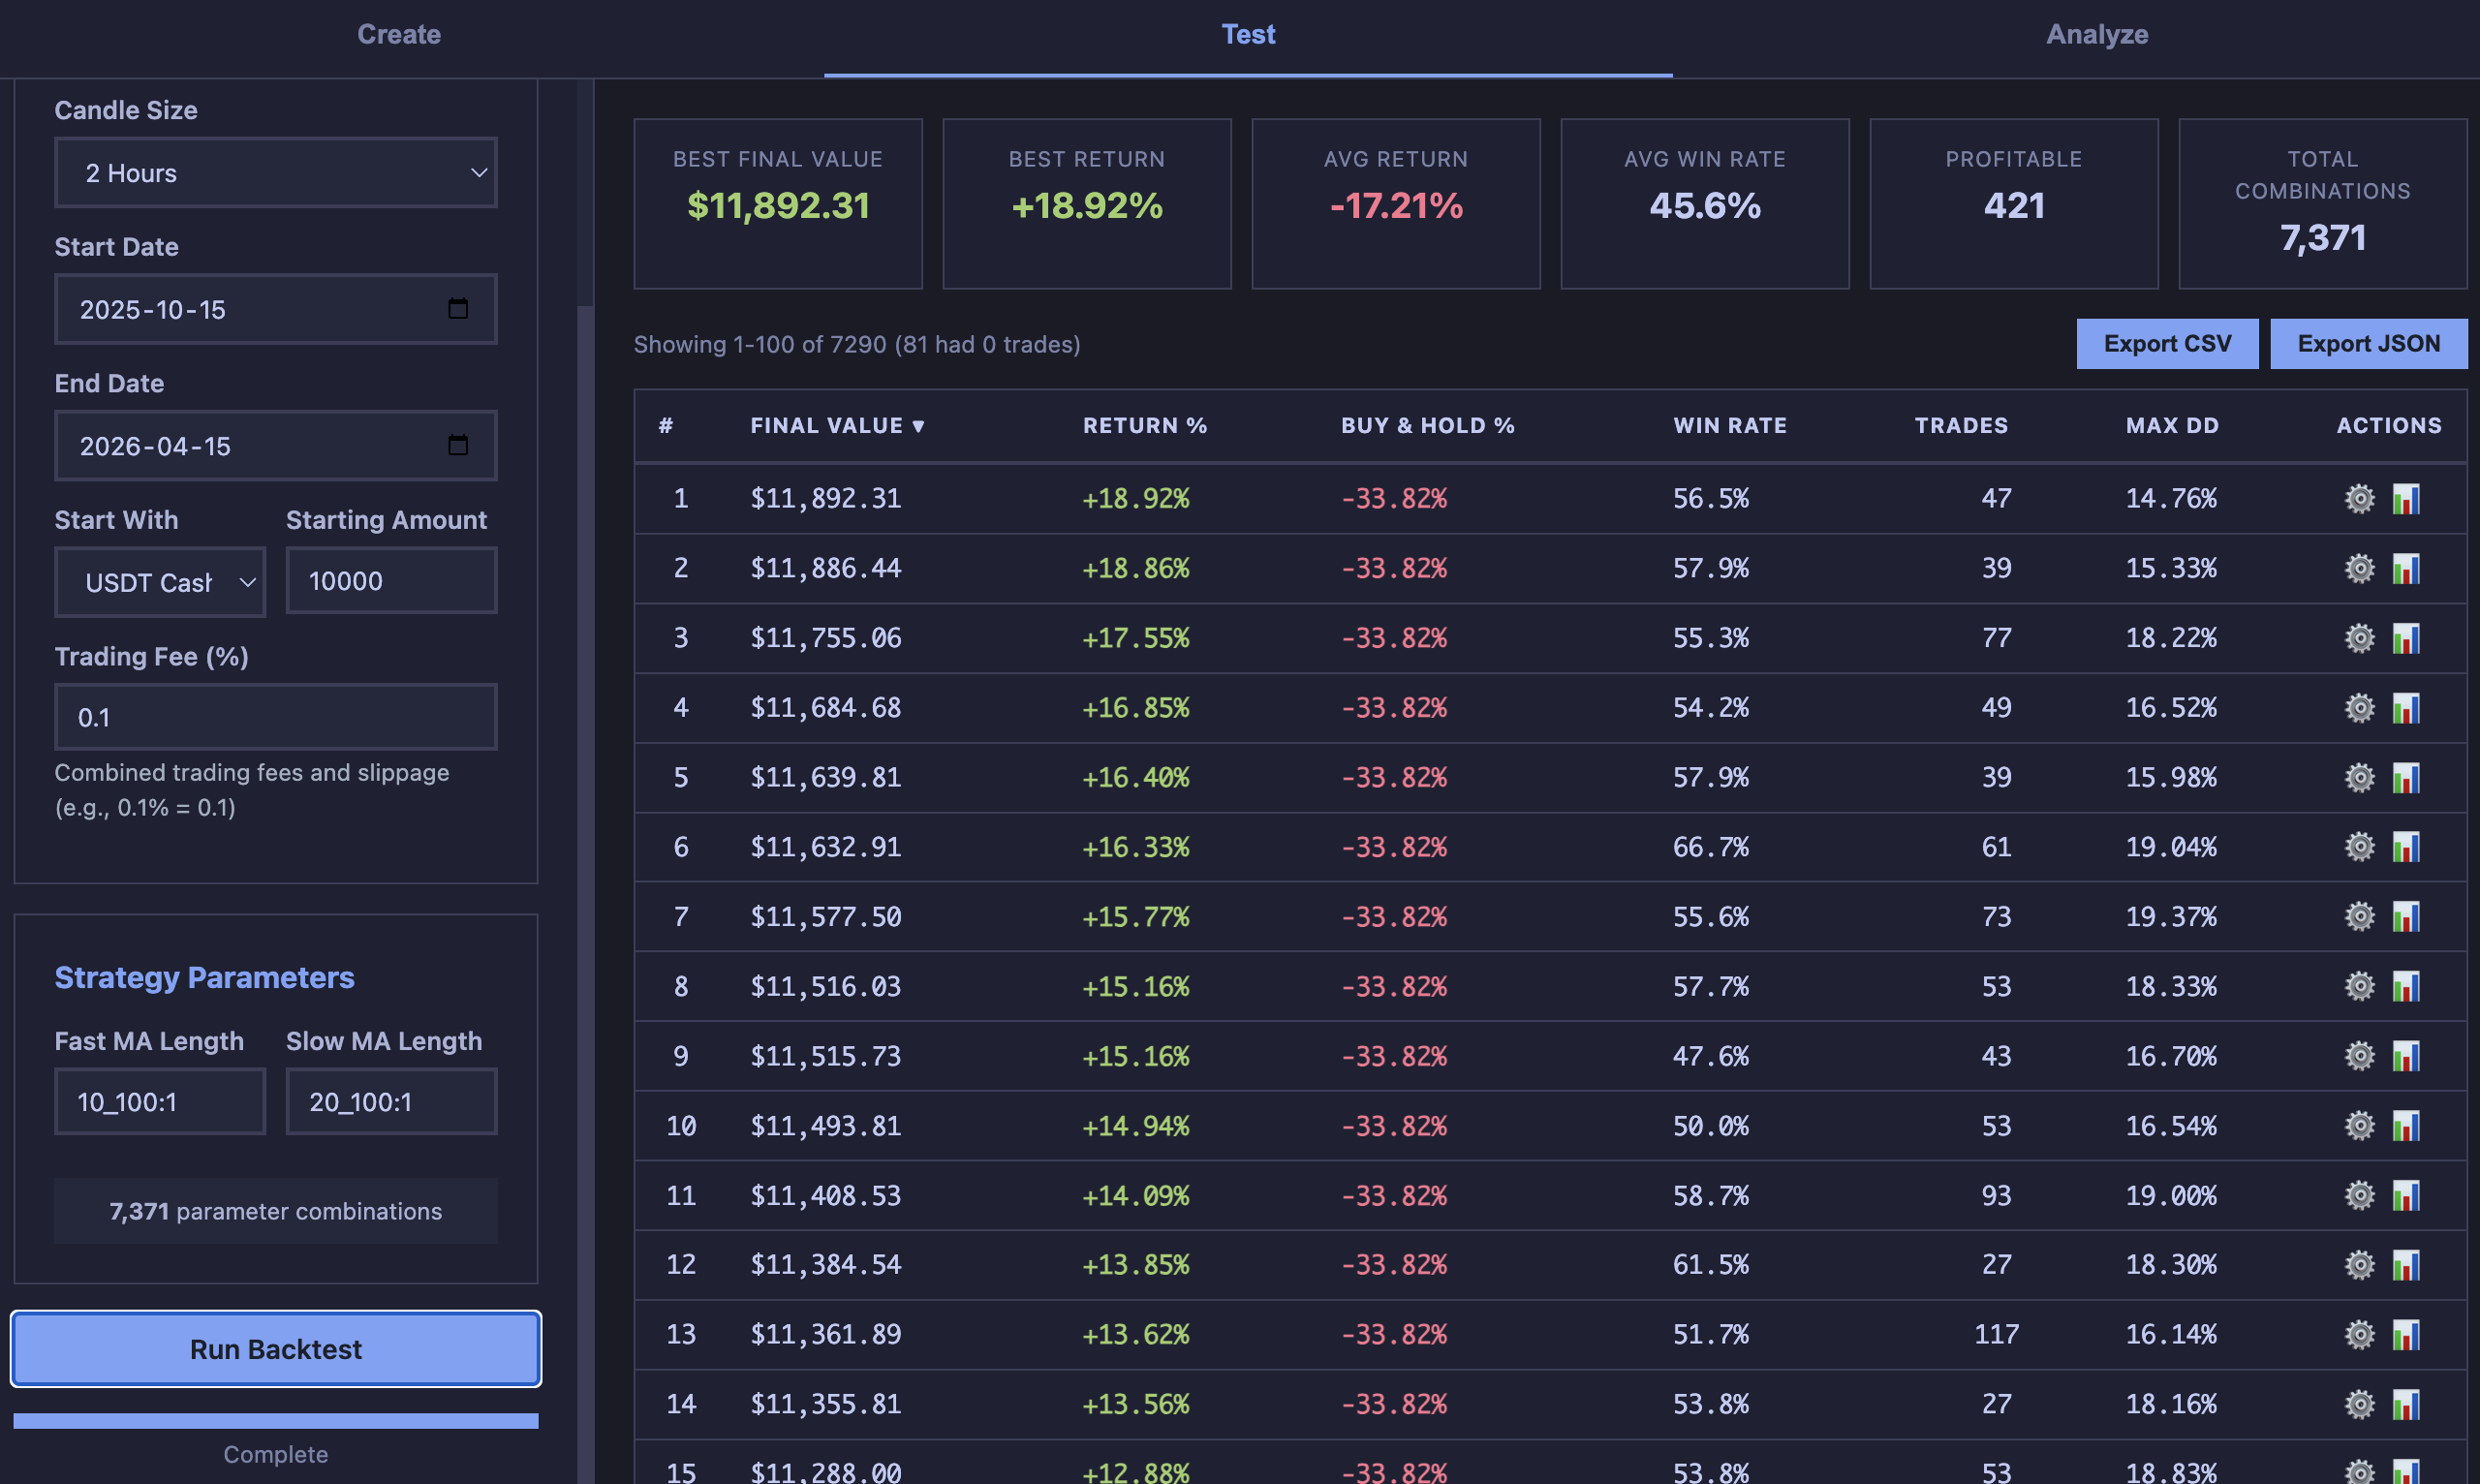
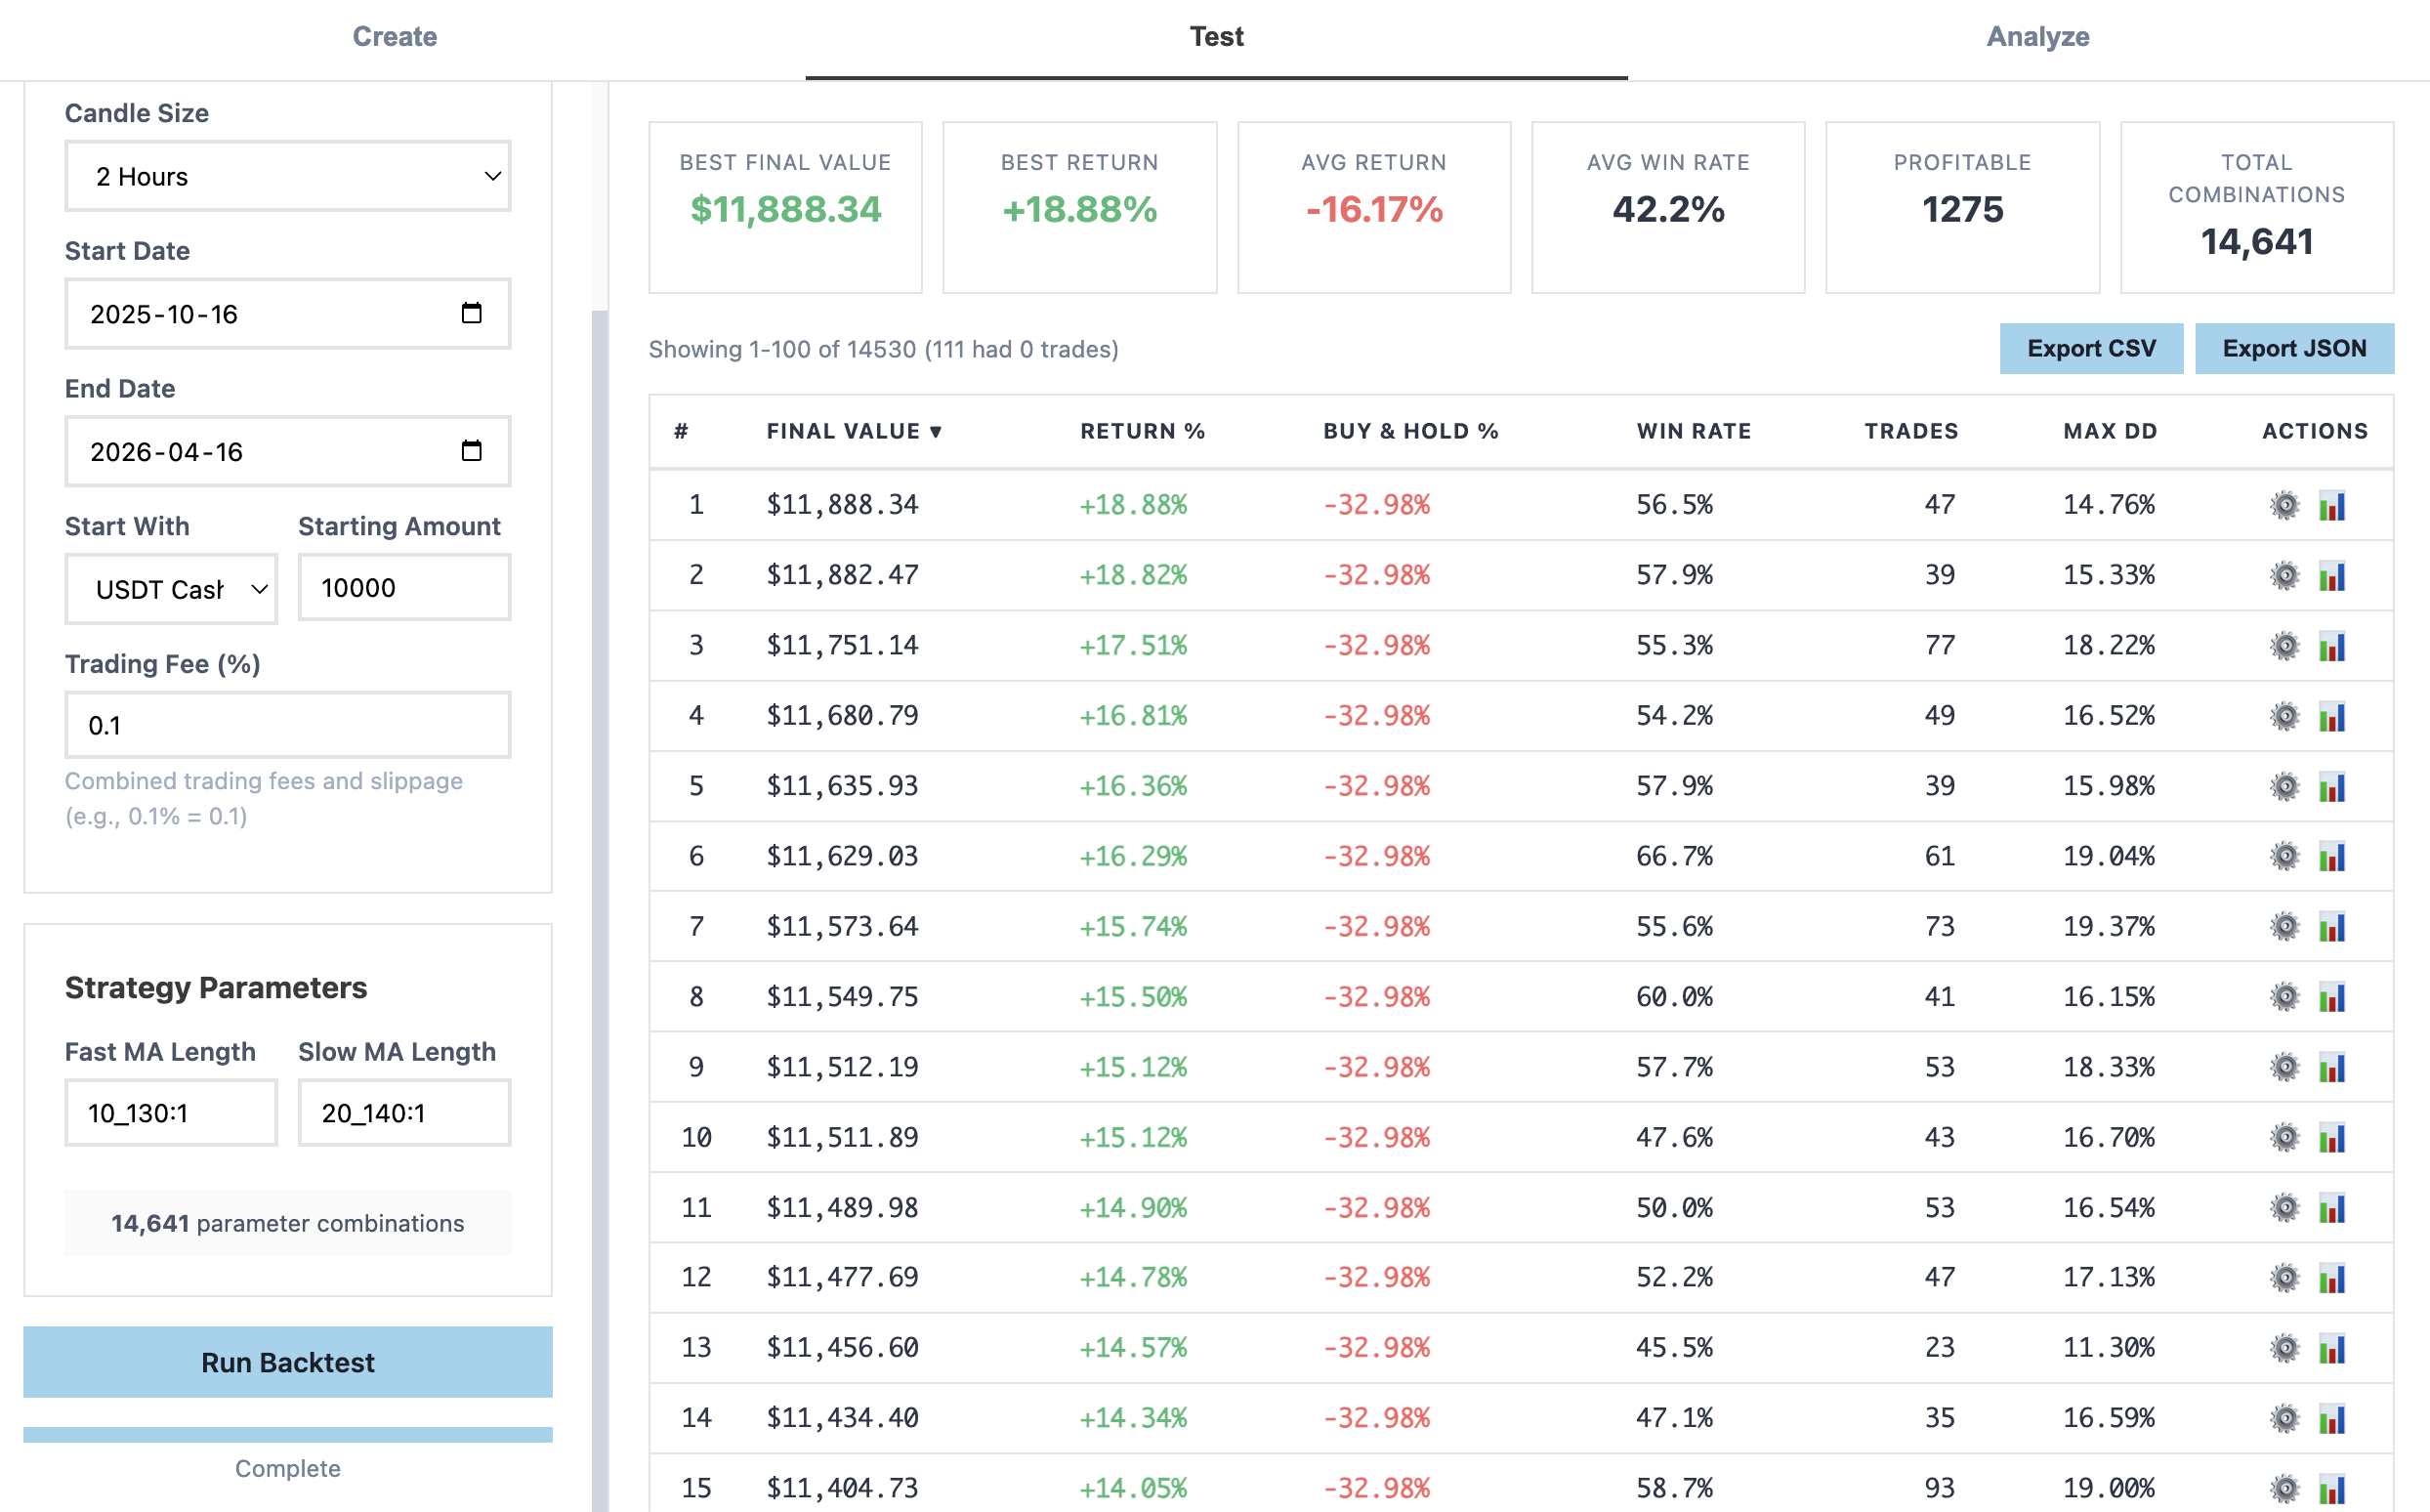
Test
A single backtest can make one parameter set look better than it is. Define ranges, run the combinations, and compare them in a ranked table.
A fast length range and a slow length range can become thousands of strategy versions. TrainBard ranks the outcomes so you can ask better questions, not guess which input to try next.
Analyze
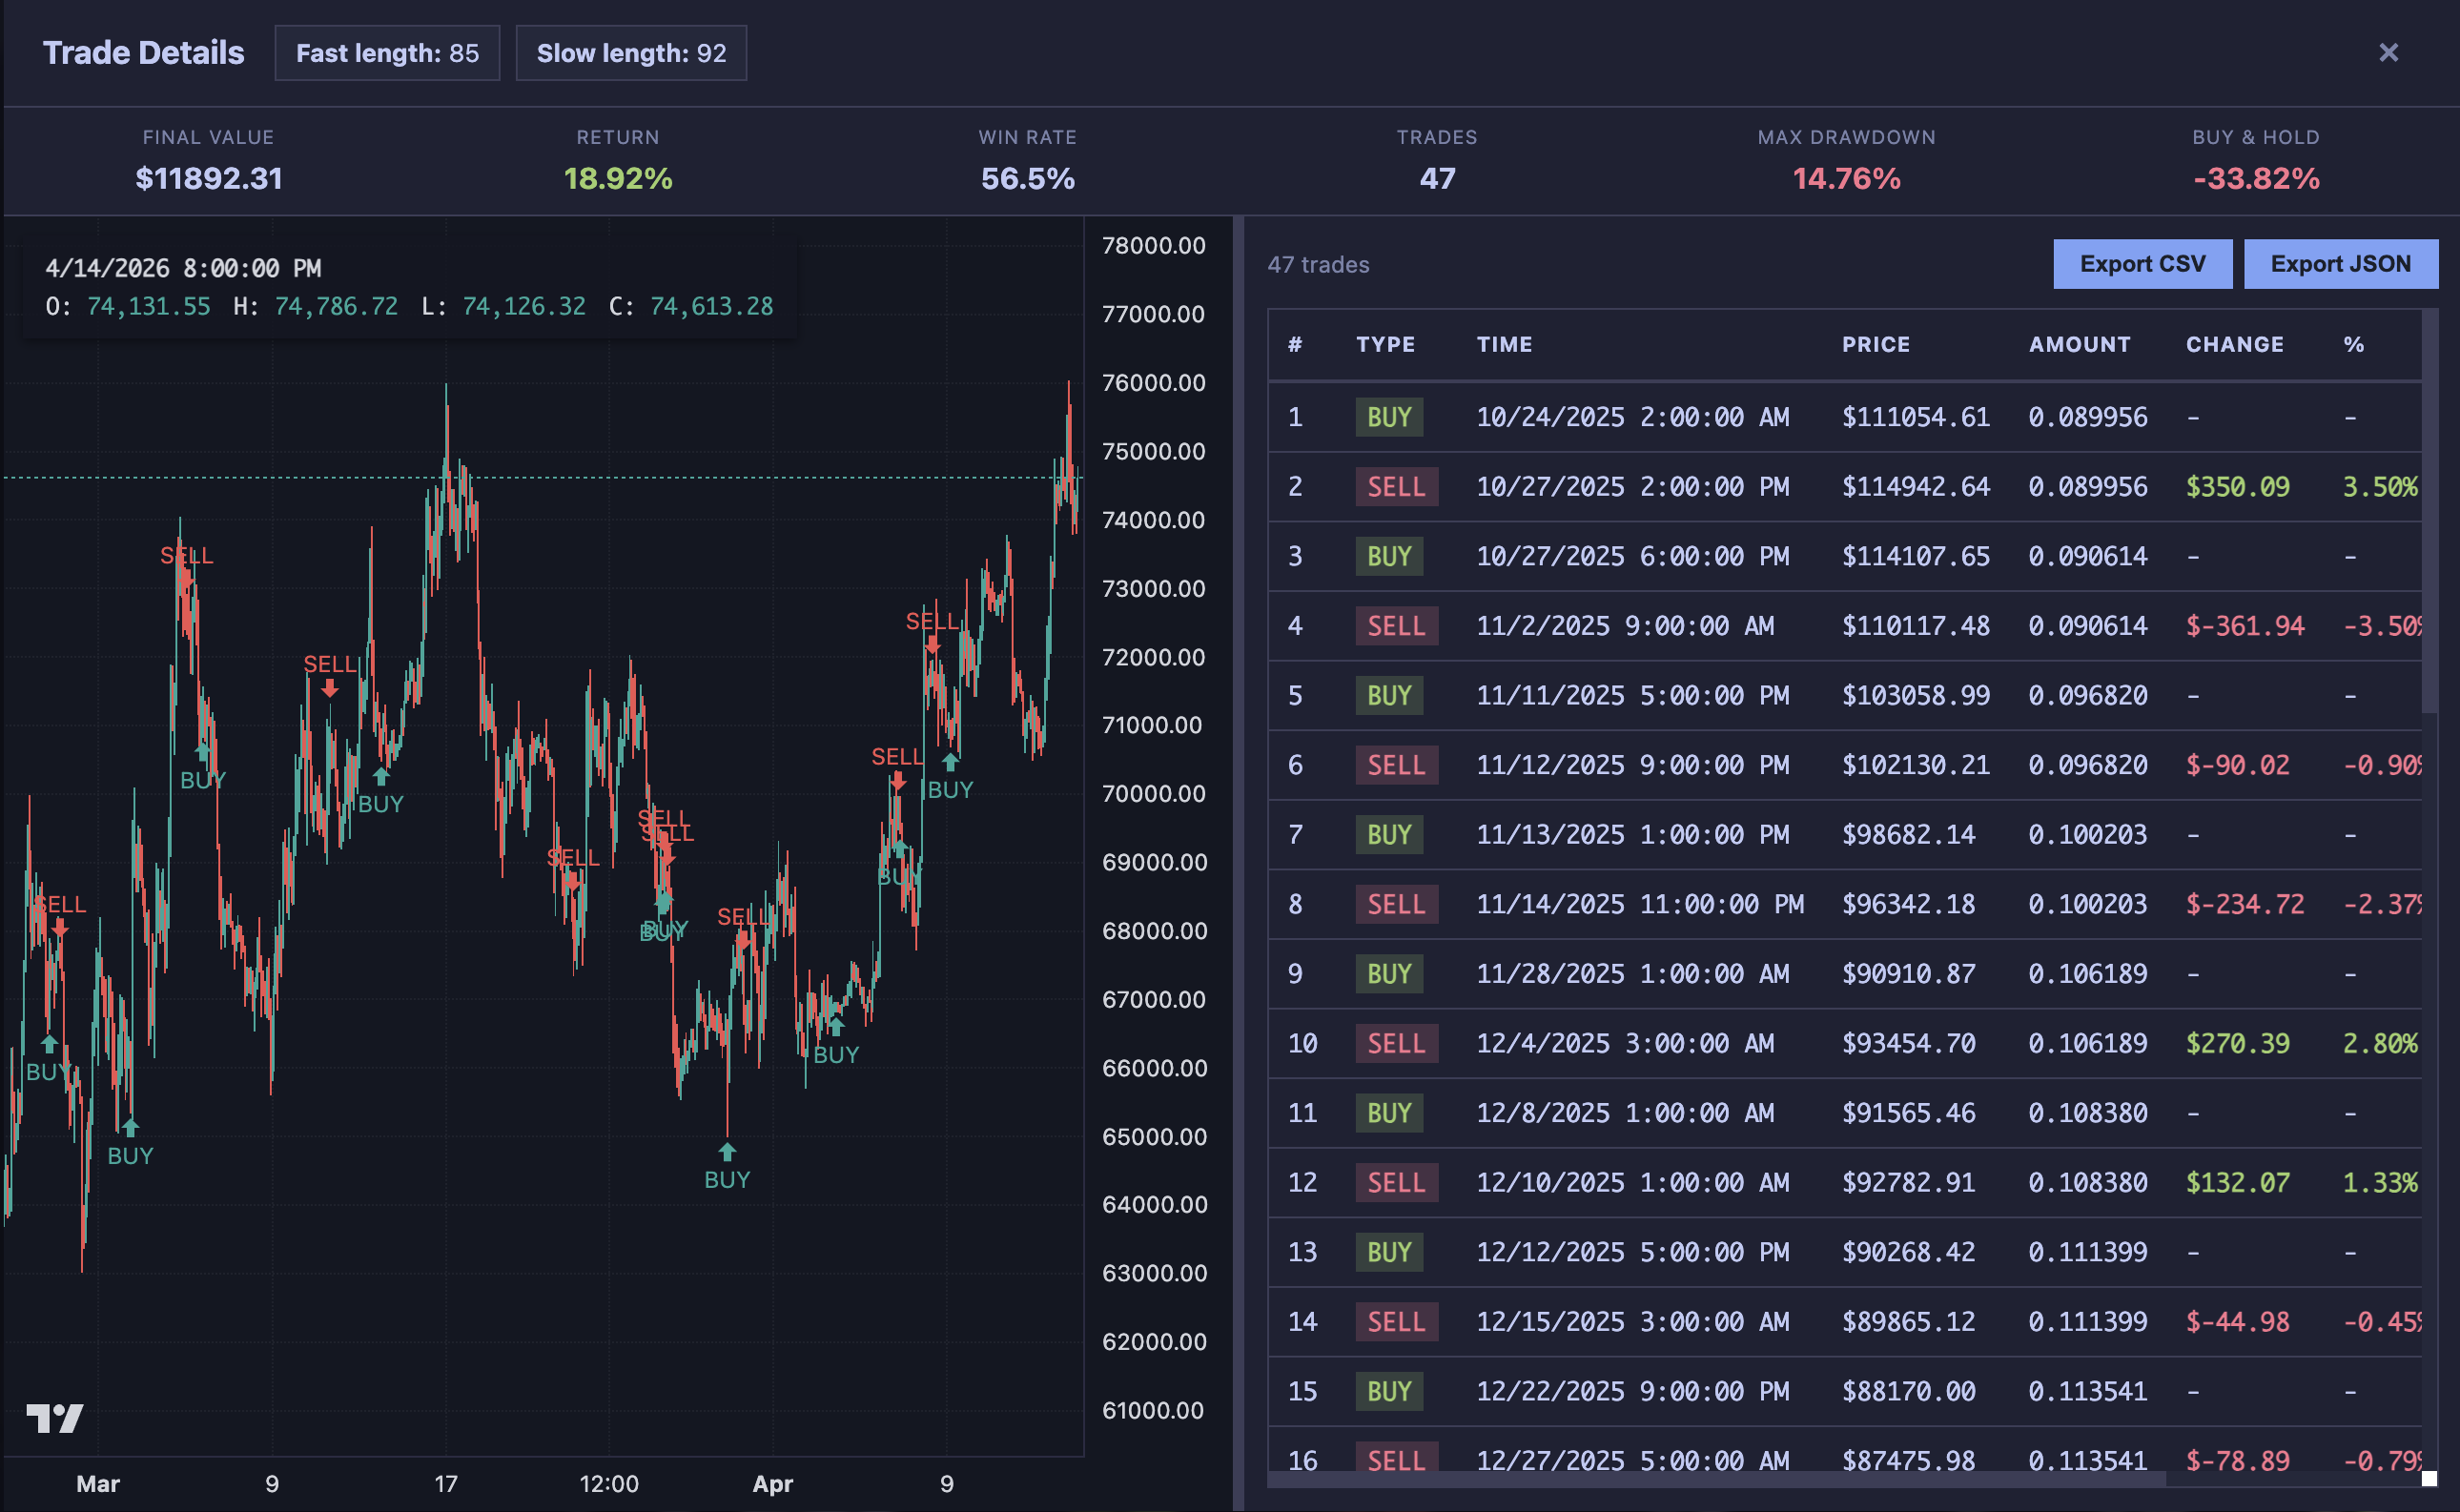
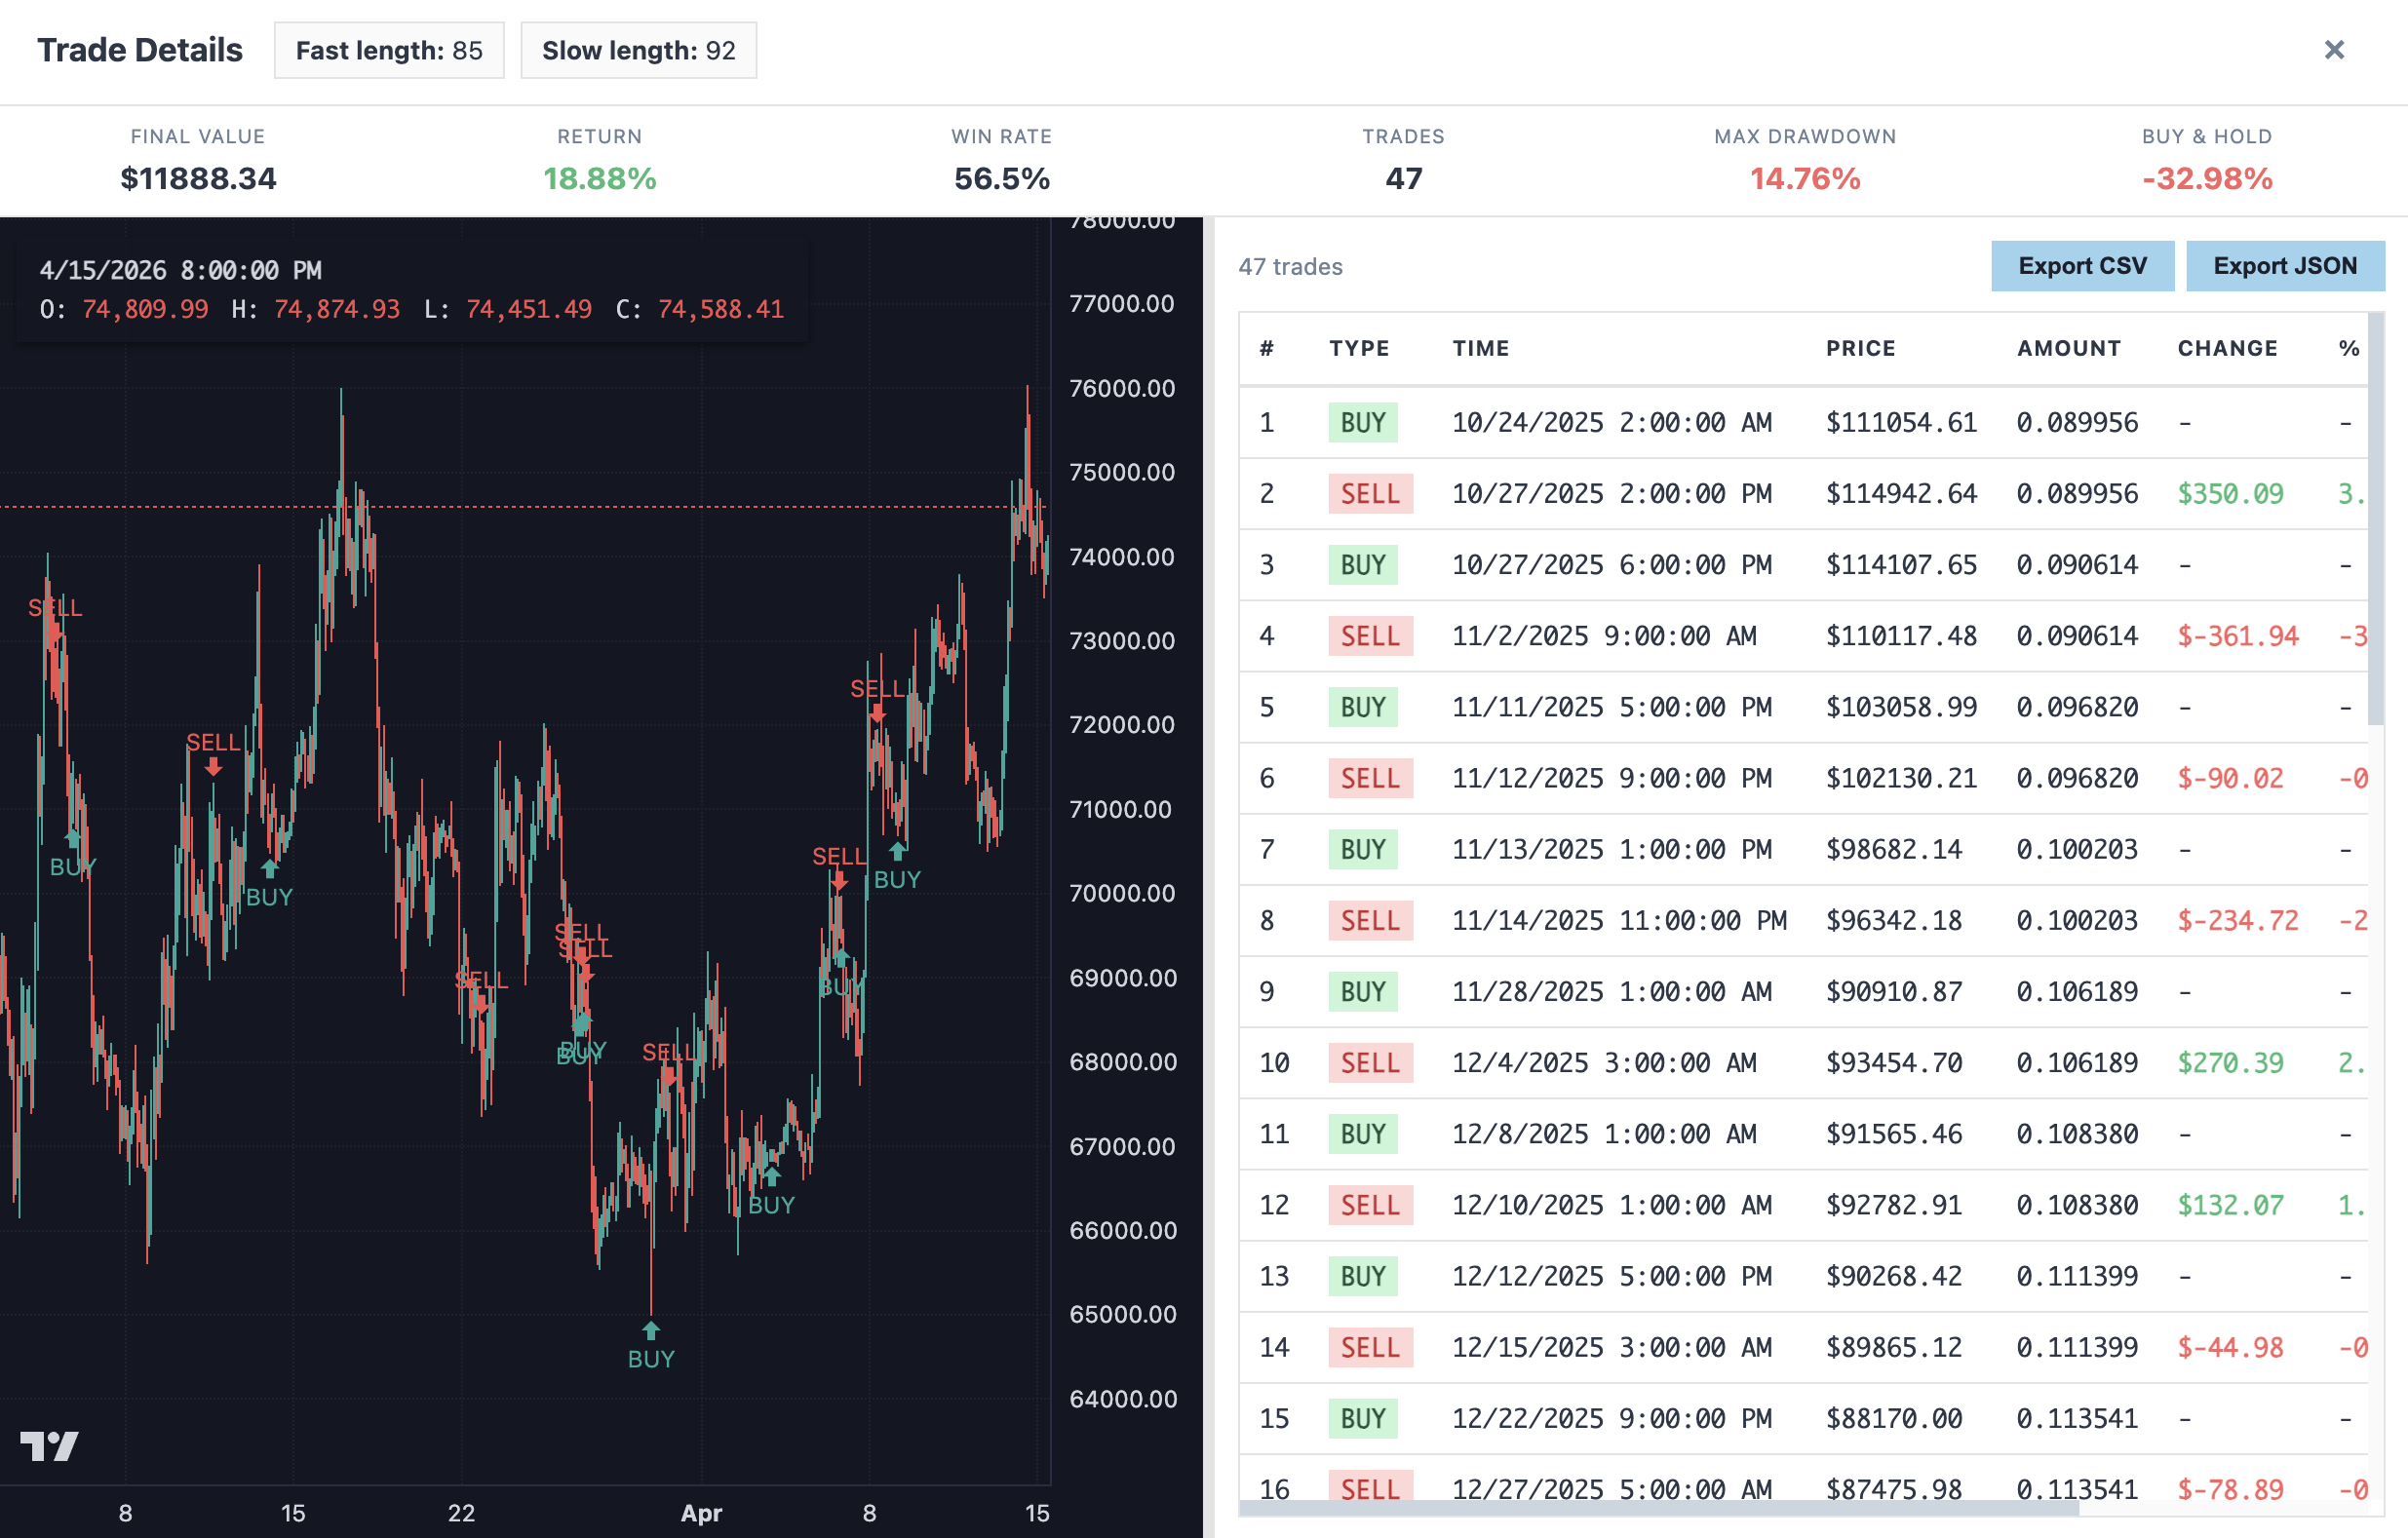
The top row is only the start. Open any result to see the chart, buy and sell markers, the trade list, fees, drawdown, and how it compared with simply holding.
Discover
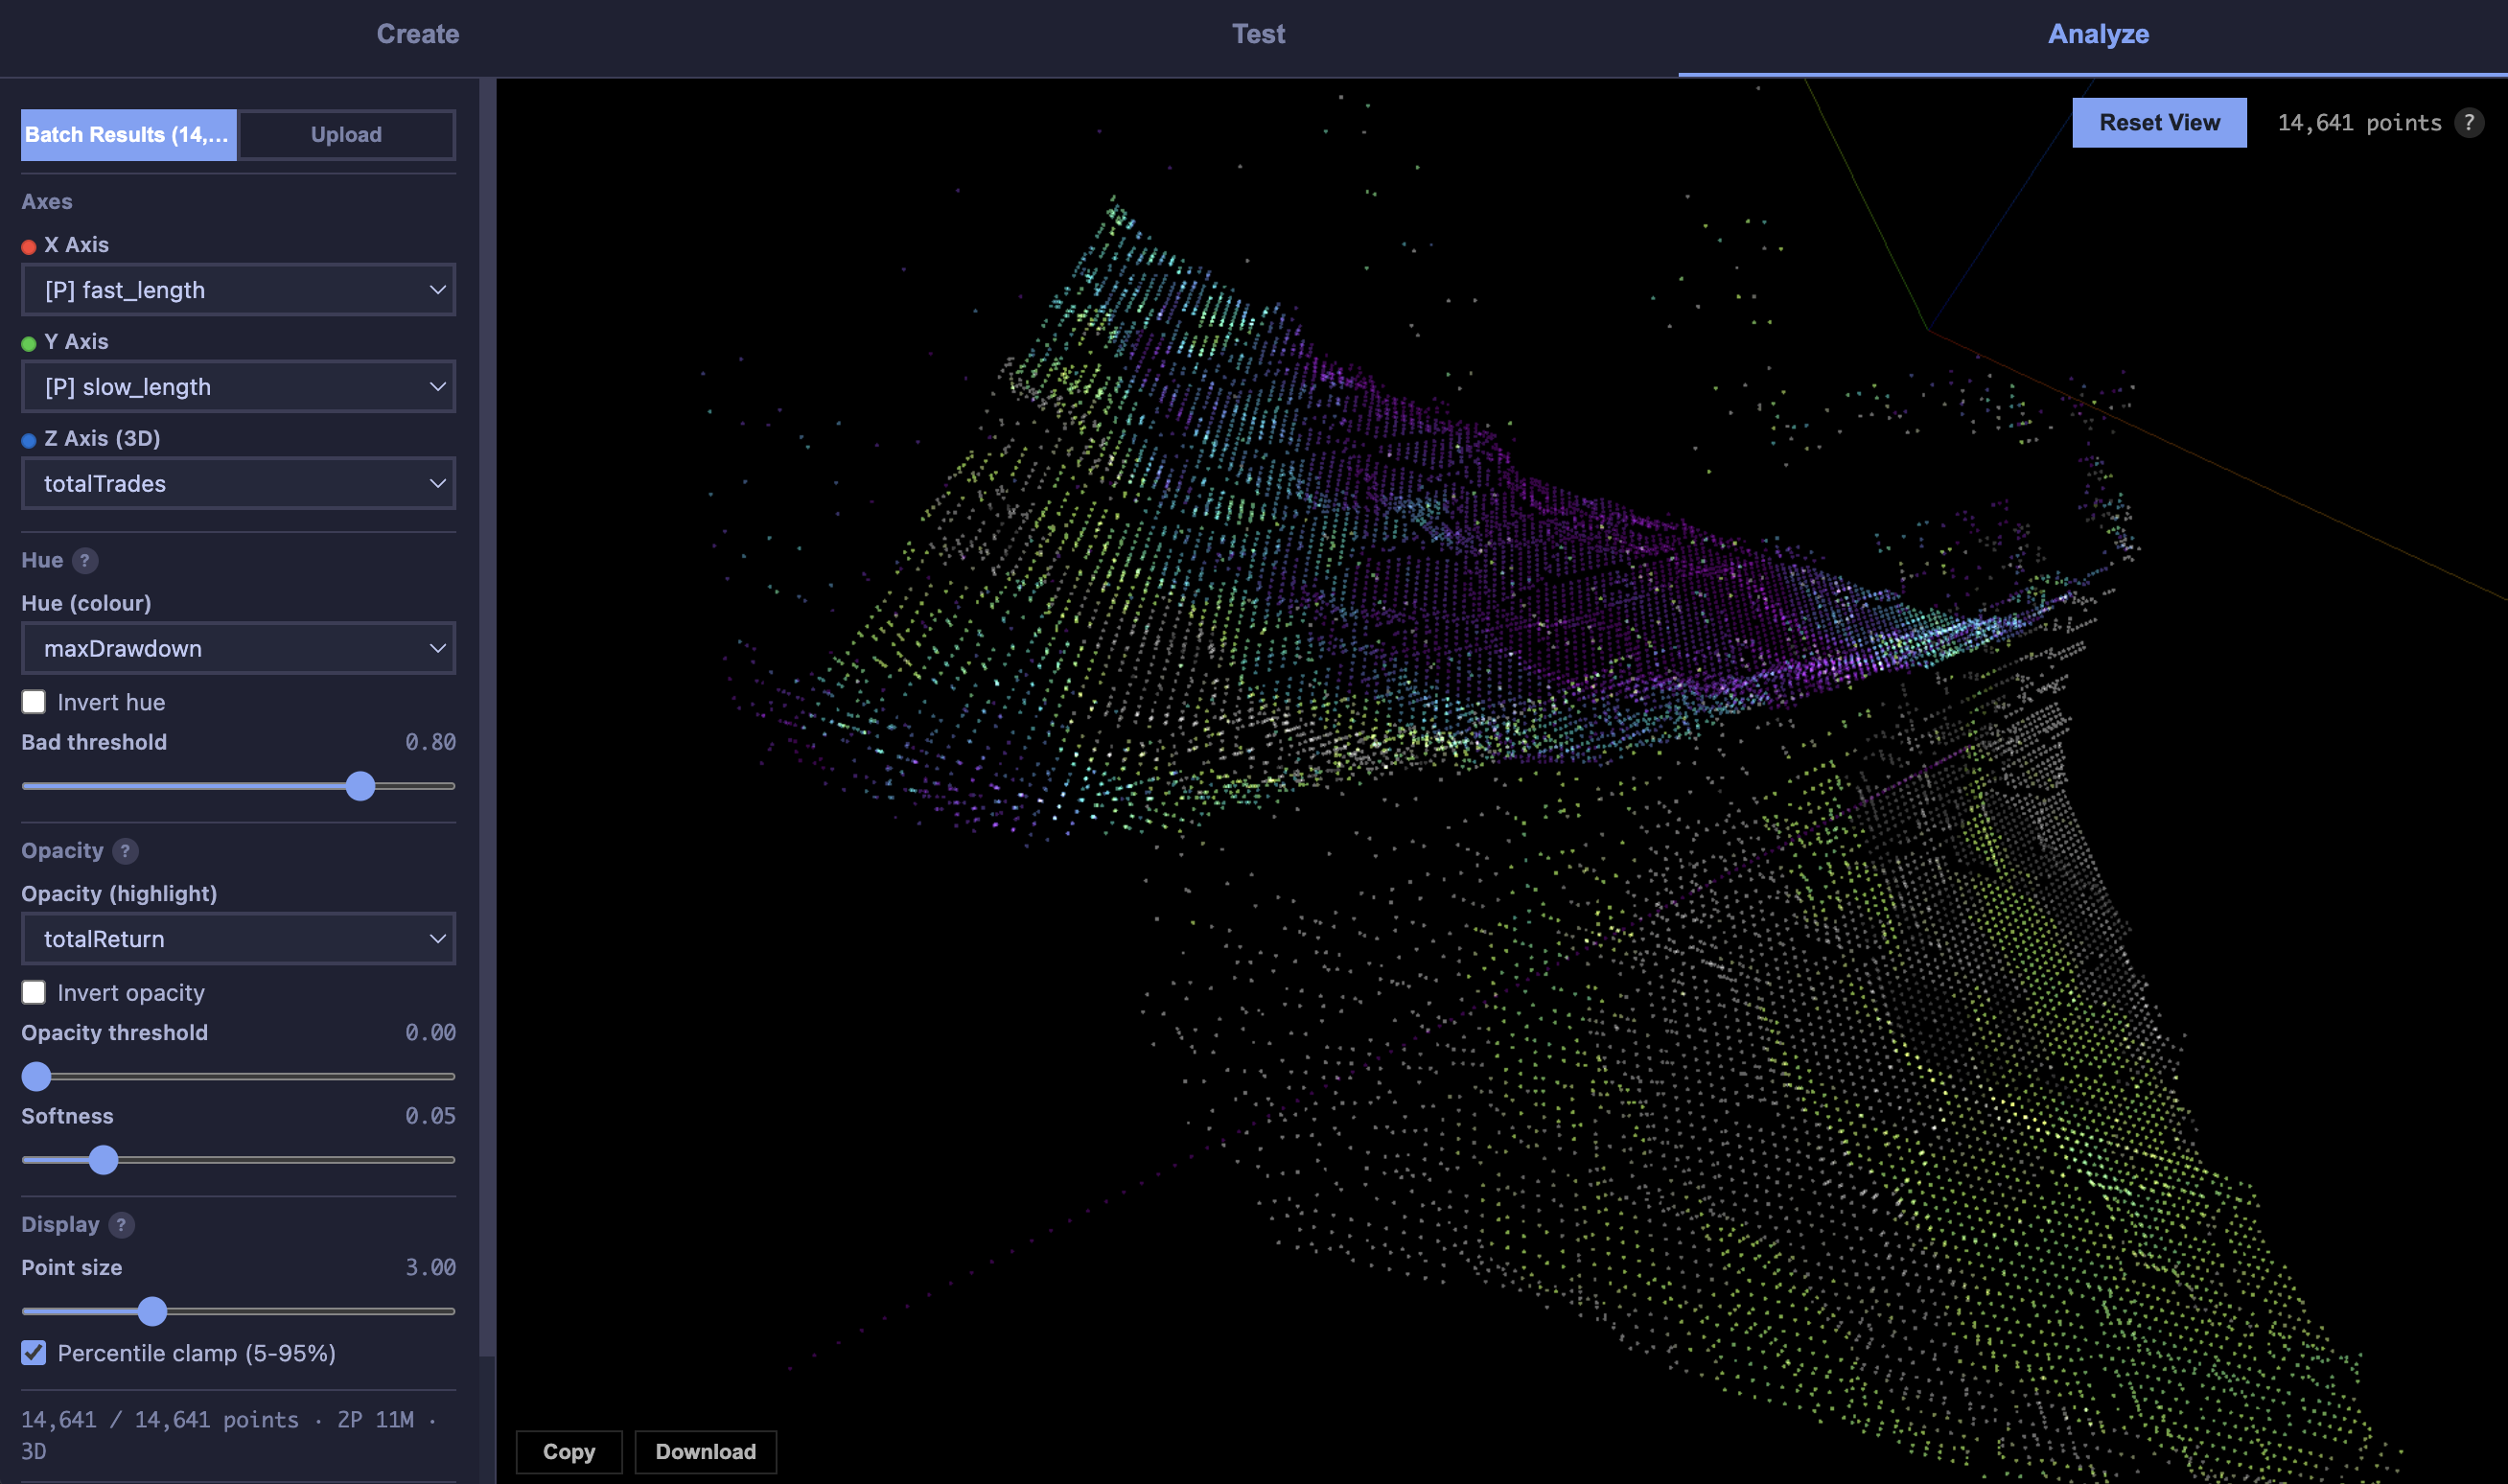
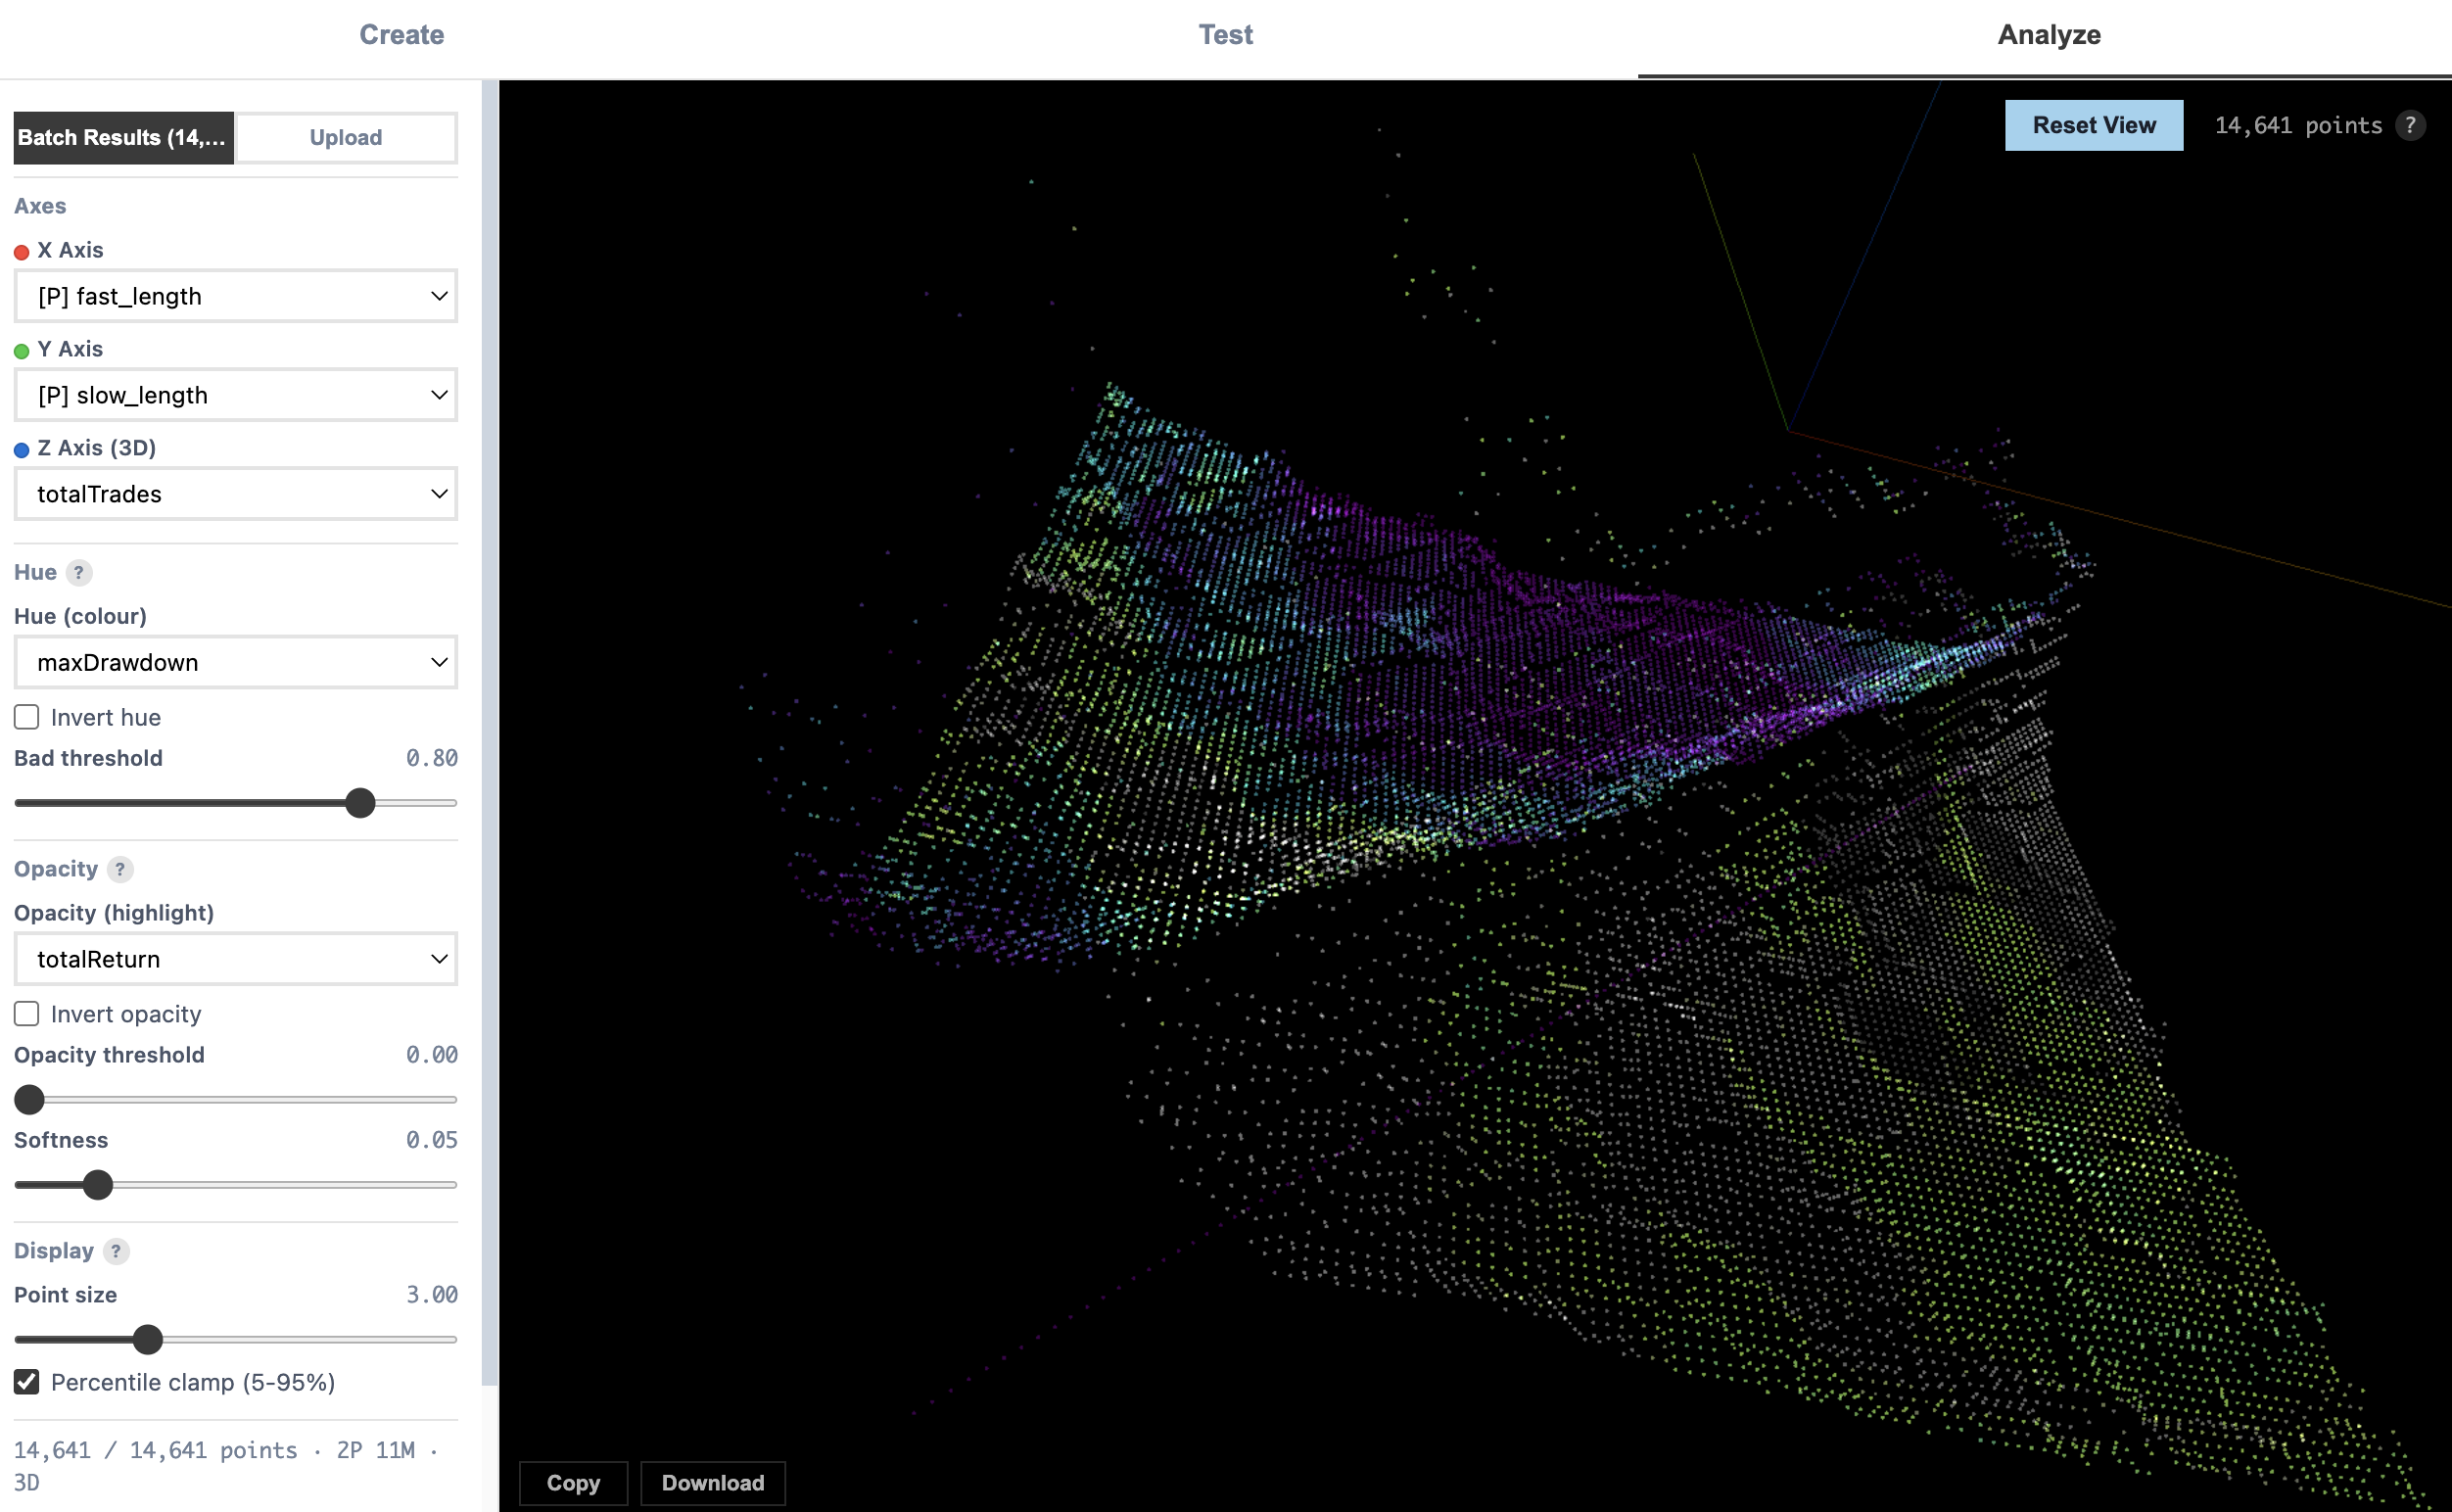
The top result can still be an outlier. The Projection Map shows clusters of settings that behave similarly, so you can separate a fragile winner from a region worth exploring.
Privacy
TrainBard sends your script to the engine, runs the backtest, and streams results back to your browser. We don't store your strategies or result history.
No cloud result history. Your scripts stay in your browser.
Pricing
Move up when you need more combinations, longer date ranges, or faster throughput.
$0
$10/mo
$25/mo
$100/mo
FAQ
Get started
Free to start. Export the work you want to keep.